New OS OpenData added to Digimap Data Download

Ordnance Survey’s most detailed open data product, Open Map – Local,  is now available to download from the Digimap service along with the OS Open Names gazetteer, OS Open Rivers water network and OS Open Roads road network. There are no restrictions on what the data can be used for,  it just needs to carry a simple copyright acknowledgement:

Contains OS data © Crown copyright [and database right] (year)
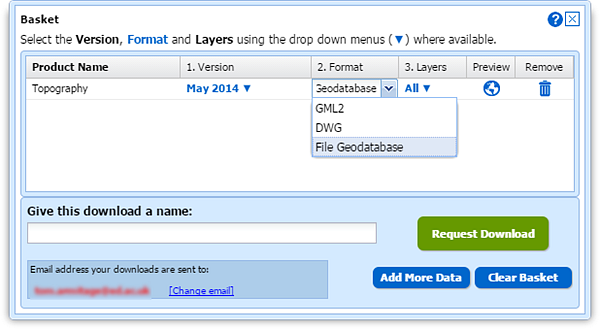
Sample Image of OS Open Map - LocalOpen Map – Local

This is a vector dataset best viewed at a scale of 1:10,000, with layers including buildings, roads, sites, railways, hydrology, coastline, woodland and cartographic text. The data comes in Shapefile format for easy access in the most commonly used GIS software.

The data isn’t quite as feature rich as the licensed VectorMap Local data, though it does contain some nice additions such as the ability to highlight public buildings and their grounds.

Sample Image of OS Open NamesOS Open Names

This is a gazetteer with 2.5 million entries, made up of over 870,000 named and numbered roads, nearly 44,000 settlements and over 1.6 million postcodes. This dataset is billed as the comprehensive list of Great Britain’s place names, road names and numbers and postcodes, and is certainly the most detailed gazetteer in Digimap. The data is available in CSV or GML formats.
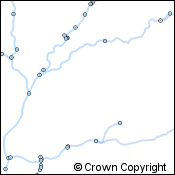
Sample Image of OS Open RiversOS Open Rivers

This is a generalised network view of the rivers of Great Britain. The data is designed to give its users a high-level view of where the water flows across the land surface.  Though it doesn’t show the detail of the actual width or shape of the river as the topographic data it is a proper network. This means it doesn’t get interrupted by bridges or other features that prevent the topographic data from being used to “route” water through the river network. The data is available in Shapefile and GML formats.
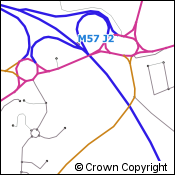
Sample Image of OS Open RoadsOS Open Roads

Like OS Open Rivers this is a generalised network of roads. Topographic data will provide more detail about the road dimensions and real world position, however this data provides an uninterrupted network for road routing analysis. The data is available in Shapefile and GML formats.


Digimap Data Download: Products Withdrawn

Data Download Withdrawn CategoryOrdnance Survey will withdraw two products in 2016, the 1:10 000 Raster data and the Land-Form PROFILE data.  To remind you that these products will no longer be available from the Digimap service we are putting them in a new category in Data Download.  The Withdrawn category will contain these datasets until we have to remove them from the site, March 2016 for  the 1:10 000 Scale Raster and September 2016 for the Land-Form PROFILE contours and DTM.

10k Raster data supersededRemember that the VectorMap Local Raster data is a more detailed generally better product to use than the 1:10 000 scale raster.  If you really need the cartography of the old version, you can create a print map from Digimap Roam which styles the VectorMap Local data to look like the 1:10 000 Scale Raster. Just zoom in to the Street or Neighbourhood view levels and then use the Basemaps button at the top left of the map to change to the VML Raster 10k styling. An added advantage to doing this is that you can add in contour lines which were never available with the old data.

Land-Form PROFILE SupersededThe Land-Form Profile data has also been superseded, you should now use the OS Terrain 5 data instead. Although it is not available in DXF format, Terrain 5 is a much improved dataset compared to the older data and it is still available in the following formats: GML, Shapefile (for the contours) and ASCII (for the DTM).

If you have any questions about the withdrawal of these datasets then please let us know:

  • Phone: 0131 650 3302
  • Email: edina@ed.ac.uk

Digimap Data: New datasets coming in the New Year

The new Ordnance Survey Licence includes some new and very interesting datasets for the Digimap service. We have already added OS Terrain 5, Ordnance Survey’s most detailed digital terrain model and contour data to the the Data Download facility. The other new datasets will require some additional effort to add into the service but we should have them available to download early in the new year. These new datasets are as follows:


OS MasterMap ITN Urban Paths

Routing information for walkers and cyclists in towns and cities.

More Info from Ordnance Survey…

OS MasterMap Sites LayerOS MasterMap Sites Layer

Identifies areas as being in categories such as schools, hospitals, transport facilities etc. The data also highlights access points to the sites and routing destinations for more accurate travel distances.

More Info from Ordnance Survey…

Points of Interest

Over 4 million points of interest classified into 3 tiers; 9 groups, 52 categories and 616 classes. The points of interest include accommodation, eating and drinking, commercial services, attractions, sport and entertainment, education and health, public infrastructure, manufacturing and production,retail, and transport.

Please note that Points of Interest data is made available under slightly different terms to the other Digimap Ordnance Survey datasets. Please see the EULA and FAQs for further details.

More Info from Ordnance Survey…


EDINA has had many requests for these datasets, especially the Urban Paths so we are very pleased to be able to offer them to you. We also intend adding some of these datasets to Digimap Roam so that they can be added to the maps you view and print as well.

Please contact the EDINA help desk if you want access to the datasets mentioned above before they are made available in the Data Download service:

  • Phone: 0131 6503302
  • Email: edina@ed.ac.uk

OS Terrain 5 added to Digimap Data Download

We have now added Ordnance Survey’s most detailed terrain data to the Data Download section of Digimap. OS Terrain 5 is created from the same source as the Ordnance Survey’s aerial imagery, meaning that it is kept up-to-date and works very well with the OS MasterMap® data.

OS Terrain 5 DTM and Contours
© Crown Copyright and Database Right 2014. Ordnance Survey (Digimap Licence)

OS Terrain 5 Contours, as the name suggests, have a 5 metre interval and the Digital Terrain Model (DTM) is on a 5 metre grid. The OS Website states the data has a good accuracy, typically exceeding 2 metres RMSE (not more than 2 metres different from the real world) with particular emphasis on significant  landscape features such as roads, railways, slopes, quarries and lakes.

From Digimap’s Data Download the you can take up to 400 5 by 5 km tiles of OS Terrain 5 in a single download.  The contour data is available in Shapefile or GML format and the DTM data is available as in ASC (Ascii Grid) format.

This new dataset has been included in Digimap due to the new licence agreement (see the previous blog post for more details). The other datasets included in the new licence, Urban Paths, MasterMap Site layer and Points of Interest data should be added into the service in the new year.

Visualising OS MasterMap® Topography Layer Building Height Attribute in AutoCAD Map 3D and InfraWorks

Update 12/02/2015: The contents of this blog post have been moved to the Digimap Help system and can be found at the following location (link opens in a new window):

http://digimap.edina.ac.uk/webhelp/digimapgis/index.htm#autocad/building_height_attribute/bha_in_autodesk.htm

For an overview of Building Height Attribute please see the following page (link opens in a new window):

http://digimap.edina.ac.uk/webhelp/digimapgis/index.htm#bha/bha.htm

InfraWorks visualisation
OS MasterMap® 1:2,000 Raster draped on top of OS Terrain™ 50, with buildings from OS MasterMap® Topography Layer extruded on top using Building Height Attribute data.

Visualising OS MasterMap® Topography Layer Building Height Attribute in QGIS

Update 12/02/2015: The contents of this blog post have been moved to the Digimap Help system and can be found at the following location (link opens in a new window):

http://digimap.edina.ac.uk/webhelp/digimapgis/index.htm#qgis/building_height_attribute/bha_in_qgis.htm

For an overview of Building Height Attribute please see the following page (link opens in a new window):

http://digimap.edina.ac.uk/webhelp/digimapgis/index.htm#bha/bha.htm

QGIS 3D visualisation with trees
OS VectorMap® Local Raster draped on top of OS Terrain™ 50, with buildings from OS MasterMap® Topography Layer Building Height Attribute and Positioned Non Coniferous Trees extruded on top


OS MasterMap® now available in File Geodatabase format from Digimap

To get the most from OS MasterMap data it is usually best to convert it from its supplied format, GML, to a format better suited to the software you are going to use it in. For our CAD users Digimap has been offering the DWG format for several months (see previous blog post); now we are offering a format that makes the data easier to use in GIS software.

Although Shapefile is still the most commonly requested GIS format it cannot handle the large file sizes (over 2GB) that could be requested from the Data Download service; an area of 100km2 in an urban centre would exceed this limit.  We therefore turned to the File Geodatabase format that works in the two most commonly used GIS software applications, ArcGIS and QGIS. There is more information about Geodatabases on Wikipedia here: Wikipedia -ArcGIS Geodatabase

To select the File Geodatabase format, add some MasterMap to your basket in Data Download. Once in the basket you can click the down arrow in the Format column and change it from the default GML to File Geodatabase:

File Geodatabase in Data Dowload

Geodatabase formats are the recommended formats  for use in ArcGIS software, being the most efficient for data storage and analysis. The format supports the use of .lyr files for styling the data and EDINA has provided some for the MasterMap data downloaded from Digimap.

The data can be added to a map in ArcGIS and QGIS in the usual way, though in QGIS you need to use Add vector layer –> Directory rather than a Database as you may assume.

Opening a Digimap File Geodatabase in QGIS

Styling information for both ArcGIS and QGIS has been provided by EDINA in .lyr and QML formats, these can be found at the bottom of Digimap’s help page for OS MasterMap. These representations give enough information to view the data in a style that OS MasterMap is commonly viewed in. The help page also contains a link to the official Ordnance Survey SLD styling information, please see the PDF that comes with the SLD files for information on how to use them.

There are help pages for adding styling information here:

If you require any help on using File Geodatabases from Digimap or any other dataset or format then please get in touch:

  • Phone: 0131 650 3302
  • Email: edina@ed.ac.uk

Visualising OS MasterMap® Topography Layer Building Height Attribute in ArcGIS and ArcGlobe

Update 12/02/2015: The contents of this blog post have been moved to the Digimap Help system and can be found at the following location (link opens in a new window):

http://digimap.edina.ac.uk/webhelp/digimapgis/index.htm#arcgis/building_height_attribute/bha_in_esri.htm

For an overview of Building Height Attribute please see the following page (link opens in a new window):

http://digimap.edina.ac.uk/webhelp/digimapgis/index.htm#bha/bha.htm

BHA data in ArcGlobe

Ordnance Survey Maps Updated: September 2014

Even though we update our mapping data throughout the year we still make a large number of changes over the summer.

Along with the general updates to MasterMap and a few other products the biggest change over the summer has been to swap the 1:10 000 Scale Raster maps to VectorMap Local Raster maps in Digimap Roam. Ordnance Survey have retired the 1:10 000 data, so we have removed it from the online maps, though you do still have a couple of options if you are a fan of the product:

  1. You can view the VectorMap Local data styled to look like the 1:10 000 maps at two zoom levels in Roam; remember that on the Map Content tab you can remove the contours for a very close representation of the mapping.
  2. We still make the 1:10 000 data available in Digimap’s Data Download interface, and will continue to do so for at least this academic year.

The table below details all of the latest changes we have made showing the currency dates of all Ordnance Survey datasets in Digimap.

Digimap Roam

Ordnance Survey product Data Currency Last updated in Roam
OS MasterMap® Topography Layer May 2014 July 2014
OS VectorMap® Local July 2014 September 2014
OS VectorMap® Local Raster July 2014 September 2014
1:25 000 Scale Colour Raster March 2014 March 2014
1:50 000 Scale Colour Raster June 2014 July 2014
Meridian™ 2 January 2014 March 2014
OS Terrain™ 50 July 2013 October 2013
OS VectorMap® District Raster September 2014 September 2014
Strategi® January 2014 March 2014
1:250 000 Scale Colour Raster June 2014 September 2014
MiniScale® January 2014 February 2014

Data Download

Ordnance Survey product Data Currency Last updated in Data Download
OS MasterMap® Integrated
Transport Network™ (ITN) Layer
May 2014 September 2014
OS MasterMap® Topography Layer May 2013 September 2014
OS MasterMap® Topography Layer Raster June 2013 October 2013
Backdrop Mapping
* 1:10 000 Scale Raster June 2013 October 2013
OS Street View® April 2014 April 2014
1:25 000 Scale Colour Raster March 2014 March 2014
OS VectorMap® Local Raster July 2014 September 2014
OS VectorMap® District Raster September 2014 September 2014
1:50 000 Scale Colour Raster June 2014 July 2014
1:250 000 Scale Colour Raster June 2014 June 2014
MiniScale® January 2014 January 2014
Land and Height Data
* Land-Form PROFILE® November 2009 September 2011
* Land-Form PROFILE® DTM November 2009 September 2011
OS Terrain™ 50 July 2014 September 2014
OS Terrain™ 50 DTM July 2014 September 2014
* Land-Form PANORAMA® November 1993 September 2011
* Land-Form PANORAMA ® DTM June 2006 September 2011
Vector Data
OS VectorMap® Local July 2014 September 2014
OS VectorMap® District September 2014 September 2014
Meridian™ 2 January 2014 February 2014
Strategi® January 2014 February 2014
Boundary and Location Data
Boundary-Line™ May 2014 May 2014
Code-Point® August 2014 September 2014
Code-Point® Open August 2014 September 2014
Code-Point® with polygons April 2014 July 2014
OS Locator™ May 2014 May 2014
1:50 000 Scale Gazetteer June 2014 June 2014

* Land-Form PANORAMA®, PROFILE® and 1:10 000 Scale Raster products have been withdrawn by Ordnance Survey and are no longer updated.

Other Updates

Remember there have also been substantial changes made to the Geology and Marine data holdings in recent months:

Please also note that there are a lot more formats available than before so you may not have to convert the data after you have downloaded it:

It is now easier to see which formats are available for the data product you are downloading and change it if you need to, this blog post shows you how:

Please let us know if you have any questions about the new data or any other changes and additions to the Digimap service

  • Email: edina@ed.ac.uk
  • Phone: 0131 650 3302


Digimap Download Basket Updates

We have updated all the new style Download interfaces in Digimap to make it easier to change the options for the data you have selected. When you have added some data to your basket you can now see more clearly what can be changed; the version (date and style), the format and the layers.

New Download Basket

Where these options are highlighted in blue with a next to them you can click them and get a drop down menu with the alternatives.

New Download basket with open menu

Make the changes you need, add a name,  then click on the Request Download button to order your data.


We have also made a slight change to the Product Information pages for some of the data products too.  Where the data is available on tiles you can now click a Show Grid button to see the tile outlines on the map.  When you make a selection on the map you will get all the grid tiles that are partially or entirely within your orange selection area.

How to View a Grid in Data Download

This feature is particularly useful for data products like the 1:10,000 and 1:25,000 scale geology data and the Marine HydroView Charts, where the data isn’t a continuous coverage and your selected area may contain no tiles. When you click the Show Grid button it will also automatically open the menu from the right of the map which allows you to change the grid shown or switch it off.

Remember, you open the Product Information panels by clicking on the blue Info links in the list of data products to the left of the map.

Please let us know if you have any questions about these changes or anything else:

  • Email: edina@ed.ac.uk
  • Phone: 0131 650 3302