
Glimmer of hope XXIV
COVID-19, ‘big data’ and rebound from lockdown.

The Calcutta Cup (the oldest rugby rivalry in the world: Scotland vs. England) helps validate Apple’s mobility product – a key potential forecaster for a safe exit from lockdown.
Summary
How is the rebound from the lockdown progressing in Scotland? That is, how rapidly are Scots starting to move around again now that the restrictions to movements and commerce are beginning to be relaxed. In more technical terms: is mobility being retained at sufficiently low levels to ensure that the reproduction number (R) stays below one?
By avoiding the temptation to rebound from lockdown before R << 1, countries can starve the COVID-19 virus by denying it transmission opportunities. ‘Big data’ holds great promise to help countries chart their most effective exit route from lockdown.
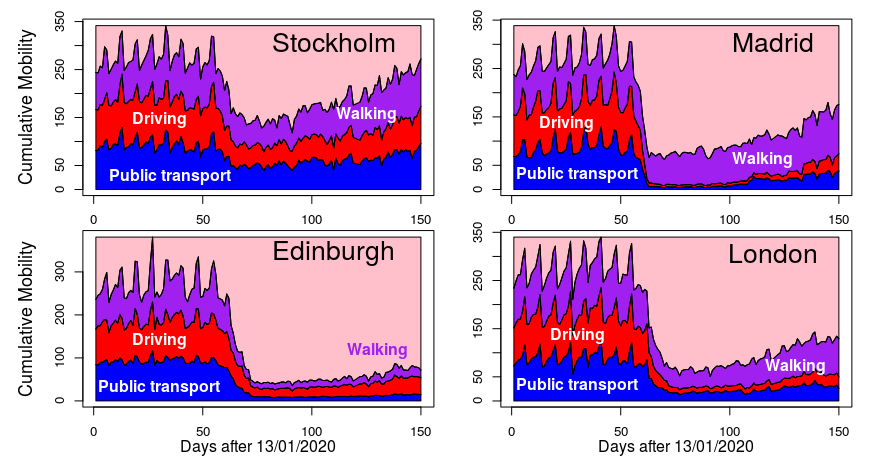
Data from Apple. All graphs start on the first day data has been made available: 14 Jan 2020. All graphs end on 10 June 2020 (just two days ago – so almost real-time). I have aggregated Apple’s three mobility indexes of public transport, driving and walking into a single cumulative index. I have scaled each individual category to 100% using the maximum weekly average (pre-WHO declaration of the pandemic) to give a cumulative range of 0 to 300%. The marked declines (at around day 60) represent quite unprecedented reduction in mobility. Stockholm can be seen to have had the least reductions in mobility and is now almost back to ‘normal’. Edinburgh shows the greatest total reduction and slowest rebound. Edinburgh’s weekend effect remains barely visible. The highest mobility peak in Edinburgh (for all three measures, but especially for walking) occurred on Saturday 8th Feb – the day of the Calcutta Cup match at Murrayfield. Madrid shows dramatic drops in driving and public transport use, along with a shift towards walking. London similarly shows a strong decline in driving and also in public transport. London’s pronounced weekly cycle in mobility has still to rebound.
Rebound
Simple, but extremely valuable, measures about the rebound and ‘escape’ from lockdown, based on mobility data from Apple and Google, are shown in the four graphs above. The idea is to use the power of ‘big data’ to try to provide assessments of otherwise hard-to-measure aspects of society. Mobility is defined as the extent to which people move beyond their home, either by ‘walking’, on ‘public transport’ or by driving.
Criticisms can certainly be made about the lack of transparency in the construction of the mobility measures and in the absence of any commitment to consistency or continuity. Also many commentators are legitimately worried about privacy, data protection, and civil-liberty issues associated with ‘big data’. Nevertheless the Apple and Google measures probably represent the best global data sets currently available on ‘real-time’ mobility. Furthermore mobility data have been shown (Nouvellet et al, Imperial College Report 26, 2020) to represent an important proxy measure of social distancing and to demonstrate an especially close link with that key measure of population-level disease transmission, the reproduction number (R). Within- and across-country comparisons (53 countries) show that 85% of variability in transmissibility is explainable by fluctuations in mobility. Mobility measures thus have tremendous potential to be an early-warning indicator of over-relaxed, over-hasty, releases of lockdown. For example they can forewarn (in the absence of other measures being firmly in place, e.g. fully operational contact-tracing) if transmissibility is set to increase again, so triggering unwanted positive exponential growth and the likelihood of a second wave of infection sweeping in.
Details of the underlying mobility methodologies are scant. Apple appear to base their measures on mobile phone data reflecting the movement of people with any Apple device using a mapping app. Every time a user makes a mobile phone interaction a call detail record (CDR) is created and stored. Google have produced a different measure of mobility, again based around mobile phone and GPS locations. Google report trends over time by geography, across visits to different categories of place such as retail and recreation, groceries and pharmacies, parks, bus and train stations, workplaces, and residential. Google provided graphs in PDF files. Chan, Skali & Torgle (2020) have very helpfully converted these PDF file graphics into CSV format using clever open-source tools, to automatically obtain numerical data from the graphs.
Apple’s mobility product is a straightforward, data-dense, Excel file. Their spreadsheet covers over 1,000 countries, cities, locations or sub-regions from all around the world. It is subdivided into public transport, driving and walking. The data are very easy to access.
Other daily travel-index measures are of road trips, of 50 miles or more, based on GPS data, or of the amount of time spent at home.
Edinburgh vs. London
The above graphs are based on Apple’s daily mobility data. I have aggregated and rescaled the data. Briefly, for each category 100% mobility is the maximum 7-day rolling average pre-lockdown. Aggregated weekly averages thus range between 0 and 300%. At the start of each time series a strong weekly effect is seen in both Edinburgh and London. Mobility then drops in a very similar way, and at a very similar time, in both capitals. According to the Apple mobility data, movement was at a minimum on the same day – Sunday 12th April – in both Edinburgh and London. Rebound however has been faster in London. The Nouvellet et al. Imperial College Report #26 points out that although mobility in the UK is still below the level associated with an R number of one, it is marginal and without effective and thorough contact-tracing any further increase in mobility could lead to a rapid epidemic regrowth.
COVID-19 is not under control in many countries
By mathematically comparing the above patterns of mobility data with the R number useful transmission-mobility relationships have been established (Nouvellet et al. 2020). COVID-19, assessed in this way, is still not under control in many countries – Sweden, Denmark, Finland and the Ukraine. In others, such as Spain, Morocco, France and perhaps the UK, reduction in mobility appears to have been sufficient to contain COVID-19 transmission. However even in these countries a sustainable lifting of population-wide social-distancing measures still needs to be undertaken really carefully. Otherwise without alternative counter measures, such as contact tracing, the virus is poised to return and recommence its steep exponential rise.
Rebound and the ‘escape’ from lockdown
‘Big data’ is often criticised, but it holds amazing promise as a tool for countries to monitor mobility, and hence to keep an eye on virus transmissibility, and so use in optimising their safe, careful escape from lockdown.


Recent comments