
Glimmer of hope VIII
Another day with an underlying downward trend across the UK.
Part VIII of Glimmer of hope. (14-April-2020)
Summary
United Kingdom still models as past peak. European countries predicted to have very different final death tallies (on a per capita basis). Scotland doing OK.
United Kingdom
Yesterday’s new data support the view that the 1st phase of COVID-19 peaked one to two days ago across the UK. The graph below plots my updated analyses.
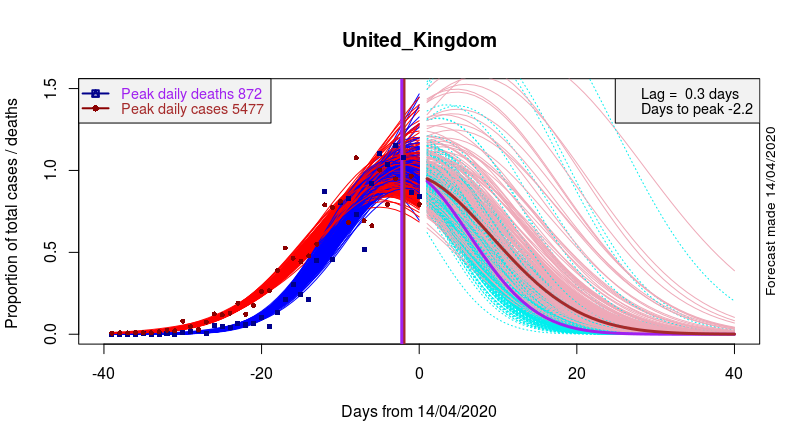
Data and model fits at left, forecasts at right. Red – Cases. Blue – Deaths. Brown – projected Cases. Purple – projected Deaths. Pink – illustrates range of plausible Cases trajectories. Cyan – illustrates range of plausible Deaths
Europe
There is much variation across Europe, both in terms of the timing of the local epidemic, and in the number of deaths that COVID-19 is causing. The graph below is rather ‘busy’. It aims to visually illustrate the eventual number of deaths, per million people, that COVID-19 can be anticipated to directly cause in over ten European countries.
The data points are daily. For example the red dot in the extreme lower right corner represents yesterday in Spain, the red dot immediately to its left the day before in Spain. By yesterday the cumulative number of Spanish deaths was 17,489 (or on a per capita basis, Q, 17,489/46,723,749 = 3.7e-04) while 517 more people, P, were reported to have died. Hubbert showed that a plot of Q vs P/Q can be used in a linear (straight line) extrapolation to determine ultimately recoverable oil-reserves, or in this example, total deaths. We need to find Q when the epidemic is finally over, i.e. when P reaches 0. In other words we need to calculate the intersections of the downward sloping lines with the bottom axis.
Some data sets are better than others. The Belgian data (cyan) are very scattered, but nevertheless Belgium looks to be heading for a very bad per capita outcome. Next comes Spain and then Italy. When expressed on a per capita basis their two trends look rather similar, with an eventual outcome of over 400 deaths per million (4e-04). France and the UK look to be doing slightly better. I project 300-350 deaths per million. The next intercept, to the left, is Sweden. With its very scattered data (black triangles, top left) Sweden is really too early to call. (It will depend on their policies.) The Netherlands, Switzerland and Germany, with intercepts further to the left, all look to be doing OK. Turkey comes out surprisingly low. One wonders about their data quality. And the brown dots and dashed line? Scotland.
I presume the reporting of deaths across most European countries has been fairly consistent. So I imagine the wide range of per capita outcomes in my modelling is likely to be a real effect. It could arise, for example, from very different political decisions about the degree and timing of lockdown that were taken in each country. The UK, of course, was very close to following a disastrous trajectory. Fortunately the Imperial College team saved the country from utter carnage. We really did have a very narrow escape.
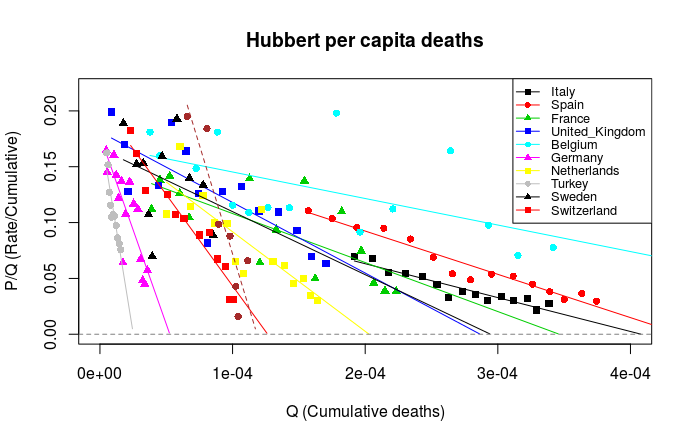
Hubbert predictions of final (per capita) death tolls. See text for details. Countries ranked (see legend) by total numbers of deaths (as of yesterday) – Italy high, Switzerland low. Scottish (per capita) deaths plotted as the brown dots and dashed line.
Previous COVID-19 blog pages


The per capita deaths are extremely variable. Is it the way things are reported? Which country does the dashed line represent?
Italy and Spain seem not too disparate. Why did you say yesterday that Italy was heartbreaking compared to Spain?
It is really interesting to see your daily blog – well done and thank you very much for your efforts.
Bruce – you are ahead of me. I was just having a break for tea, and will finish off the descriptions now. But yes the per capita deaths are very variable. I presume the reporting of deaths across European countries has been fairly consistent, so I imagine the wide range is a real effect arising, for example, from very different political decisions about the degree and timing of lockdown. The UK, of course, was very close to following a very different course. I suspect you have already surmised that the dashed curve is Scotland.