
Glimmer of hope I
Part I of Glimmer of hope. (6-April-2020)
How many global deaths will COVID-19 cause?
Summary
COVID-19 can be analysed using a tried and tested methodology previously used with great success by energy-modellers, geologists and phenologists.
Preamble
Using Hubbert’s peak-oil methodology the eventual number of global deaths from COVID-19 can be estimated. At present an extended extrapolation is needed, nevertheless a practical end-point can be glimpsed.
Being isolated, with only a chromebook for company, the maths I am embarking on needs to be kept simple. Fortunately Hubbert’s method of estimating both peak oil and remaining recoverable reserves is elegantly straightforward, and eminently transferable to the task of predicting the course of the COVID-19 pandemic. My lack of computing power also explains the low resolution graphics.
Results
Tuesday 6 April 2020
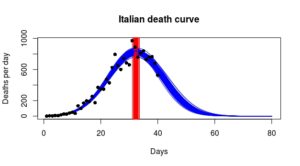
Italian deaths curve looks to be a symmetric normal, presently decreasing well. Peak fitting mathematics (epsilon-skew-normal) reveals no sign of a long tail. Click on ‘Italy’ for better graphics.
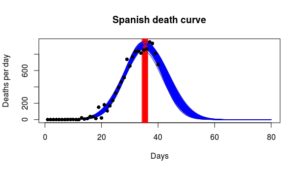
Spanish deaths curve already decreasing, although the Spanish peak (red vertical line) occurred after Italy’s. Note very similar decline pattern to Italy. Width of blue curve and red bar shows the estimated uncertainty. Click on ‘Spain’ for better graphics.
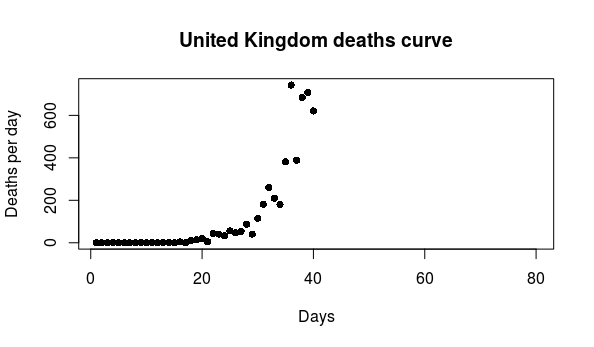
United Kingdom: Visually looks hopeful, however there is still too little data to mathematically determine the likely date of the peak. The UK curve has been lagging behind Italy and Spain. My guess is the UK’s death rate (despite today’s drop) is following the worryingly high Italian/Spanish trajectory. Tomorrow’s UK data should reveal more…
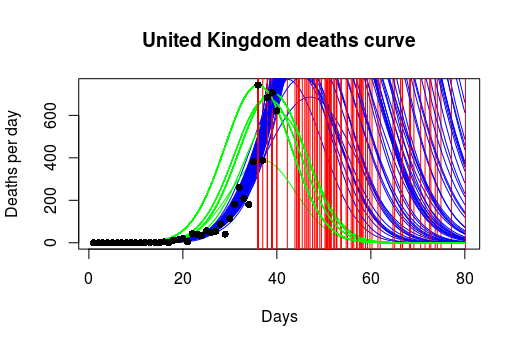
This final graph illustrates how difficult it is to know (currently) how COVID-19 will actually play out in the UK. The blue and green lines are possible trajectories. The red lines possible dates of peak. It could be anything. My best guess around 12 to 18 days from today. In truth we need more data.
Next step: Extrapolate and combine country-by-country fits in order to estimate total global deaths.
Method
Briefly, I focus on analysing registered deaths. So called test data are to my mind too variable between countries and too unreliable for formal data analysis. I check on model parsimony using ANOVA. A three-parameter model appears to be sufficient at present. This may well change! As the great John Maynard Keynes said: “When my information changes, I alter my conclusions. What do you do, sir?”
Background
Exactly one month ago I began social isolation in earnest. I unilaterally cancelled all my commitments, such as starting a 7-part circumnavigation walk around Edinburgh’s outer lanes, paths and quiet roads for a local (U3A) walking group. I also formally tried hard to persuade other U3A groups, meeting organisers and committees to immediately cancel all unnecessary meetings (in order to save lives, especially of OAPs by the simple means of social distancing). I totally failed, being branded alarmist and disruptive. After a while I have received more favourable comments such as:
“I introduced Roy’s advice [to the committee]. They felt that it was too alarmist and, all other things being equal, we would meet again in April. How wrong they were.”
So after one month of isolation I thought I would see if there was enough data available to arrive at an educated estimate of global deaths. I think there is. I have stopped watching TV / listening to the news, so have no idea what other estimates may have been arrived at. So this will be a totally independent appraisal.


Thanks Roy. Are you getting your input data from Johns Hopkins University? https://coronavirus.jhu.edu/data
(Careful, if you look at that, you may lose the independence of your appraisal…)
Isn’t the China curve the longest, so the most complete and most useful to include?
Is country wide data the best to use? (I appreciate it is probably the most easily available currently). But countries are very different sizes, and (I guess) are dominated by outbreaks in individual cities. With travel restrictions, the footprint of individual outbreaks should be smaller. I think on JHU the China and US data are broken down into smaller regions. More regions -> more curves.
I’ll look out for your next instalment.
Cheers, David
China is now plotted in part II
One view sent to me was: “I do not know why US media outlets use the inaccurate (and in many
cases misleading data) of Johns Hopkins when they have more accurate data
like this for the world: https://youtu.be/qgylp3Td1Bw or
https://www.worldometers.info/coronavirus/ and this for the USA
https://coronavirus.1point3acres.com/en “
Mike I mainly use ECDC.