We are pleased to announce that a new Ordnance Survey licence agreement for Digimap is now available.
The new End User Licence Agreement (EULA) can be viewed in the Digimap Help Pages. As part of the new licence arrangements, end users need to agree to the EULA to access the Ordnance Survey data through the Digimap Service. Initially this will need to be done every time you access the collection via a popup after you select an application, however we are working on a new registration system that will mean you only need to do this once.
There is also an updated list of FAQs for the licence.
However, if you have any questions relating to the licence please do not hesitate to contact the Digimap support team.
- Email: edina@ed.ac.uk
- Phone: 0131 650 3302
What’s changed in the new agreement?
See below for key changes. Supplementary information is available from the EULA, the Ordnance Survey website and the EDINA helpdesk.
1. The following new products have been introduced to the Digimap Ordnance Survey collection under the new licence:
- OS MasterMap® Integrated Transport Network Layer™ (ITN) Layer Urban Paths Theme.
- OS MasterMap® Topography Layer will also contain the Sites Layer.
- OS Terrain® 5, introduced as the new high resolution height dataset, replacing Land-Form PROFILE®.
- PointX Points of Interest (PoI).
These will be made available through the Digimap service as soon as possible.
2. Changes to image publication size restrictions for external use
Image publication size restrictions have changed significantly with many being removed. Please refer to the Your Obligation/Restrictions section of the EULA, specifically Clause 5.1.4 and 5.2.
3. Public sector data sharing rights
In certain situations, it is now possible for you to share Digimap Ordnance Survey data with government departments and for government departments to share their Ordnance Survey data with you. For further details please see FAQs 27 & 28 in Licence FAQ section and consult the EULA Clause 4.
4. Authorised Data Handler
Where a Digimap Authorised User needs to use Ordnance Survey data in a secure data service, the new Digimap Licence now permits that via a separate Digimap Data Handler Agreement. Please see EULA Clause 3.1.4.
5. Educational navigation product/service
For Educational Use, you are now permitted to build Educational navigation apps. See the EULA, Clause 3.4 for the scope of what is permitted.
6. Use of YouTube and Twitter
You may now publish Ordnance Survey data, in line with strict terms detailed in EULA Clause 5, on YouTube and Twitter.
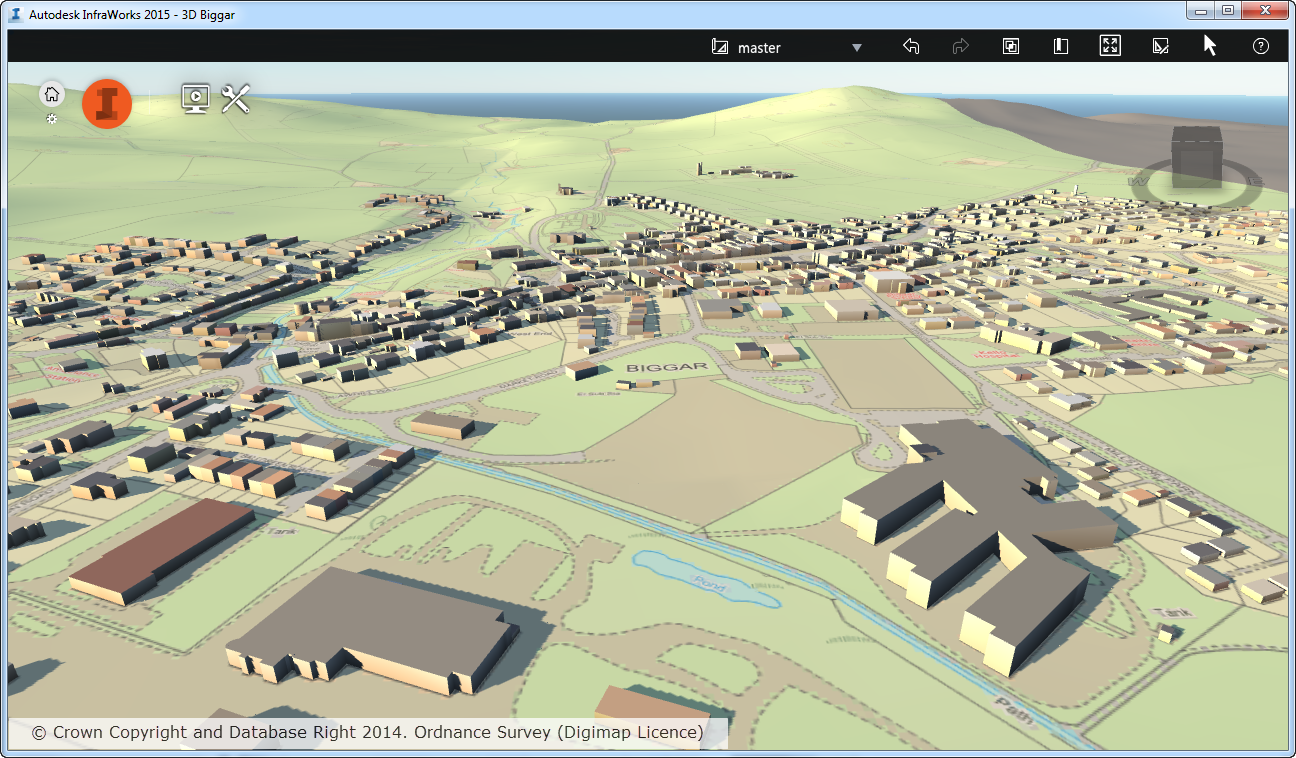
7. There is a change in the copyright notice that must be included on any maps
You must include the following acknowledgements on any display or reproduction of the Ordnance Survey Licensed data:
© Crown Copyright and Database Right [insert date]. Ordnance Survey (Digimap Licence)
Where the date to be inserted should be the current year.
For HE institutions:
If you are responsible for your HE institution subscribing to Digimap Ordnance Survey Collection you should already have received an email from Jisc Collections detailing how your institution can agree to the new Sub-Licence. Full details can be found on the Jisc Collections website.
If you have any further questions then please contact the Digimap Support team:
- Email: edina@ed.ac.uk
- Phone: 0131 650 3302

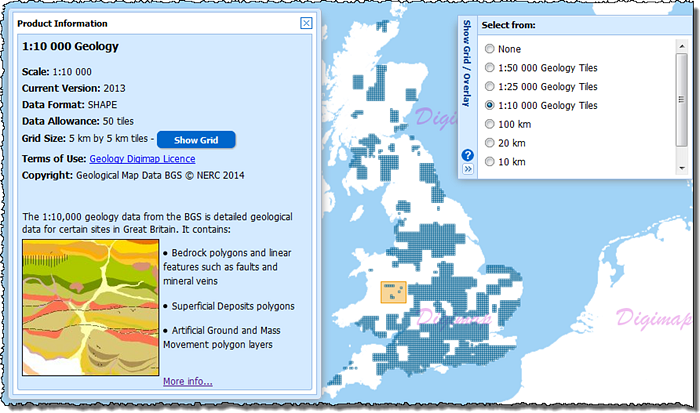
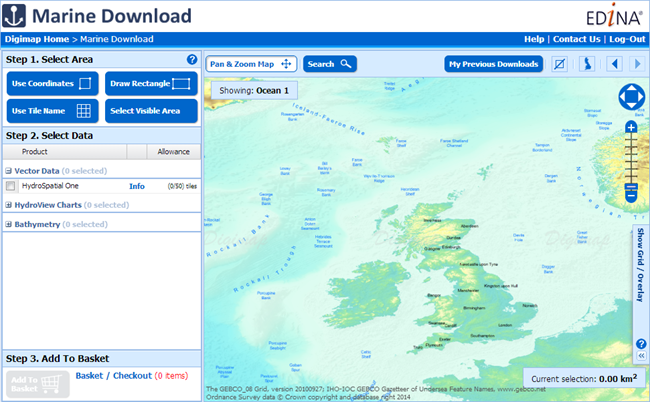
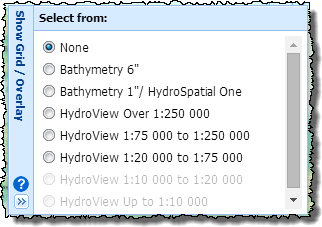 Marine Download works in the same way as Data Download, Environment Download and Geology Download; you select your area, pick your products and download the data. The main difference is with datasets as these don’t all form continuous coverage of the UK Coastal waters. We have therefore included overlays that show where the tiles of each dataset can be found. These are very useful when choosing your data, just open the “Show Grid / Overlay” menu on the right of the map and pick the overlay for the data you are selecting.
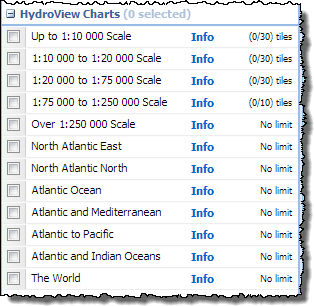 The data in Marine Download is broken into three categories, Hydrospatial, Hydroview Charts and Bathymetry. In the Hydrospatial category the same themes as before can be found, the Hydroview Charts are broken up into categories depending on their scale including those extra charts with wider ocean or global extents.