

At the University’s Learning and Teaching Conference in June, Alan Murray, Professor of Neural Electronics, presented a ‘Did you know?’ talk on simple techniques to help students understand fundamental mathematical representations. Alan has summarised his talk, with helpful examples, in the following post…
Mathematics and statistics are crucial to most Science and Engineering subjects. Understanding and interpreting data is important in many subjects and areas of work. In most cases, “understanding” really means “having a feel for” and this form of intuitive understanding is often the hardest nut to crack. Maths is also one of the biggest worries for many students of STEM subjects and one of the most fundamental problems is seeing and feeling what an intimidating lump of maths is telling us.
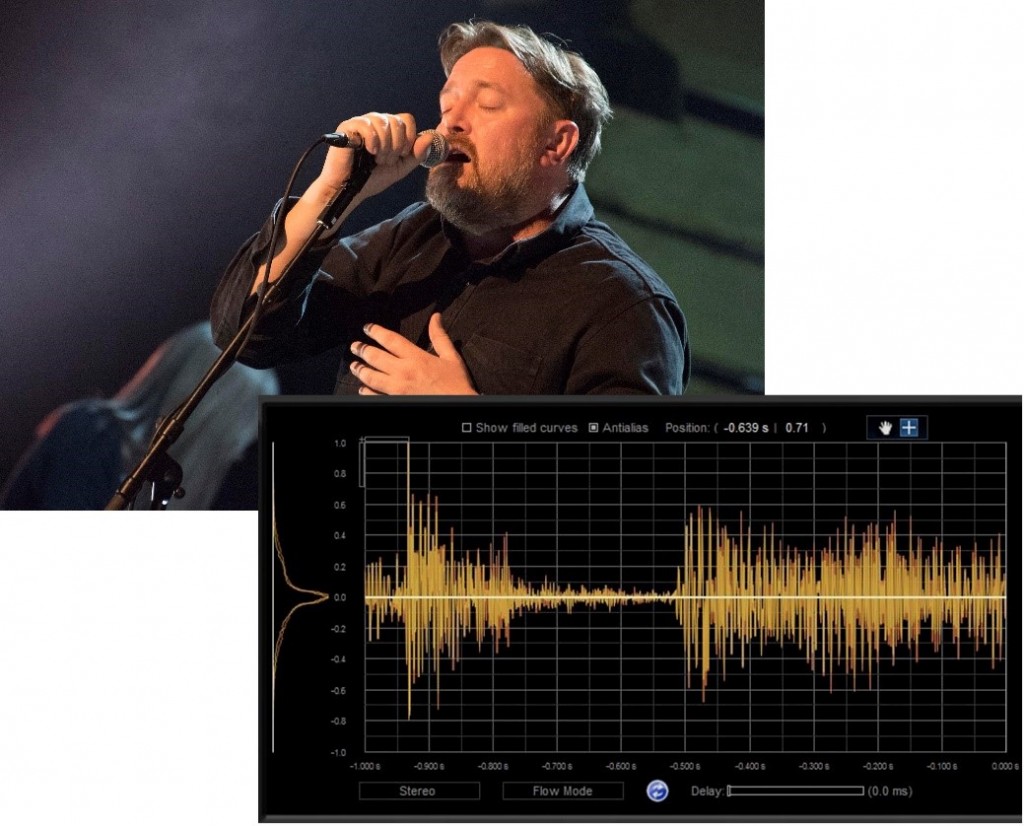
As an example (and touching on my favourite subject!), students generally have no problem with relating to the sound of a singer’s voice and with the wiggles it makes on an oscilloscope screen:
![]()
This causes an immediate and acute problem of understanding for many. Suddenly, loudness, or volume, becomes “amplitude” – An in the equation – and “pitch” becomes ω0. Schools often avoid tackling this issue of abstraction in favour of simply teaching pupils how to manipulate the symbols and numbers in order to pass examinations.
The toolbox that I’ve offered to our students (also here) is a simple set of computer simulations that allow students, for example, to “waggle the controls” of an equation, a set of statistics or a circuit (etc). In this example, they can use simple “slider” controls to adjust the values of An, ω0 and φn and watch the effect on A, the result. They can also switch bits of maths or chunks of circuit on and off. The effect on the signal can be seen in real time as the controls are adjusted. The simple example in the image above is in the Toybox and looks like this:

The simulations are all based on Microsoft’s Excel spreadsheet. This is not the “correct” tool for simulation at all. Excel has to be persuaded – cajoled gently and occasionally bullied – to impersonate a simulator. It is, however, ubiquitous and free at the point of use. Anyone, anywhere can therefore download and run these simple simulations. All that’s needed is a Windows computer running Excel. In more detailed mathematical subjects, programmes like Python, Mathcad and Matlab are especially designed to provide a higher level of mathematical modelling. However, they are expensive, even when purchased as educational one-off licenses.
Other examples in the toybox show the ability to simulate simple, circuits – for example:

I have also (during a quiet lunch hour in May) put together an example that steps out of Science and Engineering to model population growth in two classic forms – logistic and exponential, following mildly intimidating equations:


Here it is:

The ruses that allow me to subvert Excel’s normal function are:
- Slider and button controls in the Activex and forms section of Excel
- Dropping equations and diagrams into the “spreadsheet-simulation” to illustrate its subject
- Hiding the spreadsheet grid (!)
- When a simulation is one of an effect in time, making time a variable and control it using a slider control. This can make time go backwards … hello Dr Who!
Students enjoy these simple tools as they can be downloaded, used and even interfered with. They can, in effect, tweak equations to see how they work. They can also tweak circuits, to understand their behaviour in an unbreakable simulation before building a real one that can most definitely be broken.
As this is Excel, there’s always a table of numbers somewhere to make it all work. If you try this for yourself, the first “toy” you create will take some time and probably a couple of phone calls to me. Once you’ve learned the tricks I’ve used, you will be off and running, and will probably invent more. If you do, please share them with me.
P.S. If you don’t know Elbow – try their 2018 Best Of or start with Build a Rocket Boys. It’s one of my Desert-Island Discs.

Alan Murray is Professor of Neural Electronics and Assistant Principal, Academic Support at the University of Edinburgh. He introduced the Pulse Stream method for analogue neural VLSI in 1985. Alan’s interests are now in (a) direct interaction between silicon and real neuronal cells and (b) silicon chips for biomedical applications. He currently leads the £5.2M IMPACT (Implantable Microsystems for Personalised And-Cancer Treatment) project, funded by an EPSRC Programme Grant and has a passion for teaching. Alan has taught at all levels over his years as a lecturer, Reader and Professor and currently enjoys teaching first year engineering, first year electronics and third year Electromagnetics courses. Alan is a Fellow of IET, IEEE and the Royal Society of Edinburgh, Principal Fellow of the HEA and has published over 340 academic papers.