
Glimmer of hope VII
Excellent day for UK, COVID-19 peaks
Part VII of Glimmer of hope. (13-April-2020)
Summary
The main health threat (from COVID-19 1st phase) will from today onwards diminish – as long as the UK lockdown is firmly maintained and the public continues to support it.
United Kingdom
For the first time my model puts the UK as having entered the post-peak phase of COVID-19. For an excellent example of how the post-peak phase can play out see the paragraph about Spain below. Of course there is still a long way to go in the UK. Nevertheless I conclude there is more than a glimmer of hope.
This is the end of the Easter weekend so a note of caution must be sounded about the most recent data. Revisions, both up or down, are quite possible and these would change the model projections. However, taking the data at face value, the model results are clear. My main swathe of projections puts the UK squarely on mid-course (brown and purple curves) through the 1st phase of its COVID-19 journey.
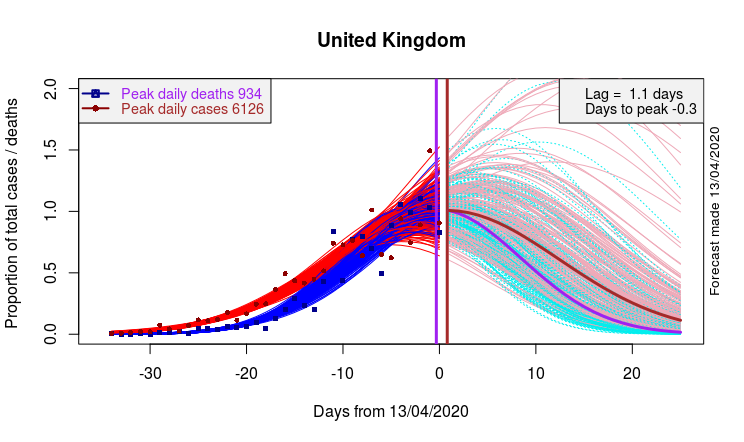
Data and model fits at left, forecasts at right. Red – Cases. Blue – Deaths. Brown – projected Cases. Purple – projected Deaths. Pink – illustrates range of plausible Cases trajectories. Cyan – illustrates range of plausible Deaths trajectories.
The histograms below show how well the model is estimating the date of the peak. Both datasets analysed (deaths and cases) put us at peak. Only a small number of models now put peak around 8 to 20, or more, days away (long tail at lower right of histogram below) or a very high peak in the pipe-line (pink curves, top right above).
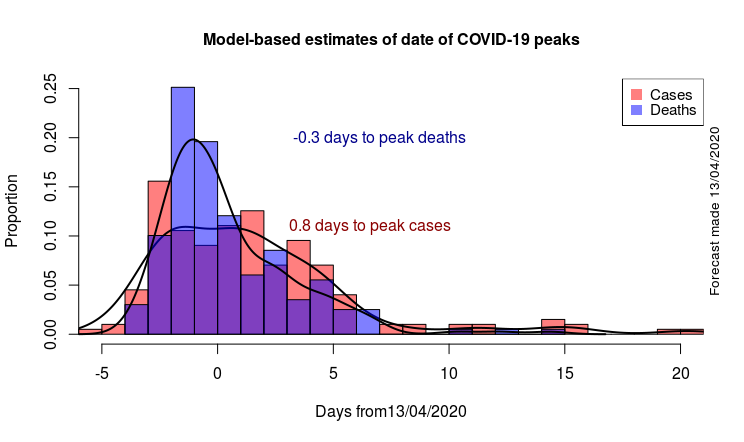
Histograms of estimated date of peak COVID-19 cases (red) and deaths (blue). Unlike in yesterday’s analysis the timing for the peak is quite well determined.
Spain
The trajectory of COVID-19 in Spain is beautifully mapped out by the Hubbert-peak mathematics I have been employing. The resemblance of the cases (red) and deaths (blue) curve is remarkably similar to Hubbert’s work on oil-reserves and oil-production. In Hubbert’s model oil-production lagged behind discoveries by 10 years. With COVID-19 the lag between new cases and deaths (in the population as a whole) is just a few days (cf. 1.7 days between peaks in graph below).
The contrast between the Spanish trajectory and the Italian trajectory is heart breaking. I find that Italy has still not reached peak. The sharp Italy-Spain divergence points to clear policy lessons for other countries to learn and adopt. If the Spanish populace can continue to practise avoidance then my model predicts they will be through and out of the worst in a week to ten days time (tight band of cyan and pink projections below).
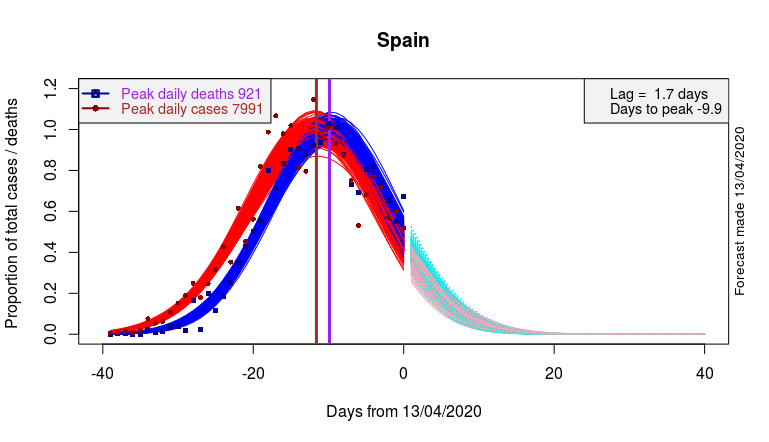 Data and model fits at left, forecasts at right. Red – Cases. Blue – Deaths. Brown – projected Cases. Purple – projected Deaths. Pink – illustrates range of plausible Cases trajectories. Cyan – illustrates range of plausible Deaths trajectories.
Scotland
I now have the time-series of daily Scottish deaths. I hope to report on my analyses tomorrow.
Previous COVID-19 blog pages


Can you show the Italy curves?