
Glimmer of hope VI
Bad day for UK as COVID-19 cases surge
Part VI of Glimmer of hope. (12-April-2020)
Summary
Despite yesterday’s surge in new cases and the number of Covid-19 hospital patients who have died in the UK passing the grim 10,000 milestone, I continue to model the peak as being only days away.
United Kingdom
Despite yesterday’s surge in new cases I still model peak COVID-19 as being close. However the modelling is having difficulties deciding between two scenarios – a low scenario where the number of peak cases has already passed, and a high scenario where peak arrives in 10 to 20 days time. The wide spread in predictions (pink lines, topright) illustrates this wide range of possibilities, as does the double hump and the extended right-hand tail (in pink) in the histogram below. The high scenario is very reminiscent of the model that was produced by the Institute for Health Metrics and Evaluation (IHME) in Seattle which predicted 66,000 UK deaths from Covid-19 by August, with a peak of nearly 3,000 a day.
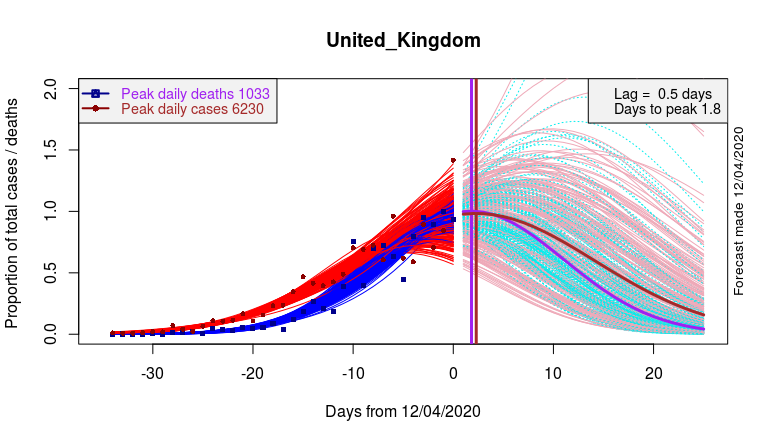
Data and model fits at left, forecasts at right. Red – Cases. Blue – Deaths. Brown – projected Cases. Purple – projected Deaths. Pink – illustrates range of plausible Cases trajectories. Cyan – illustrates range of plausible Deaths trajectories.
In contrast to the surge in new cases, yesterday’s deaths were inline with those of previous days. So prediction based on the death rate (blue curves above and blue histogram below) are little changed from yesterday’s blog. Reasonably tight confidence limits are found. With this data set the peak is placed at only 1.8 days away.
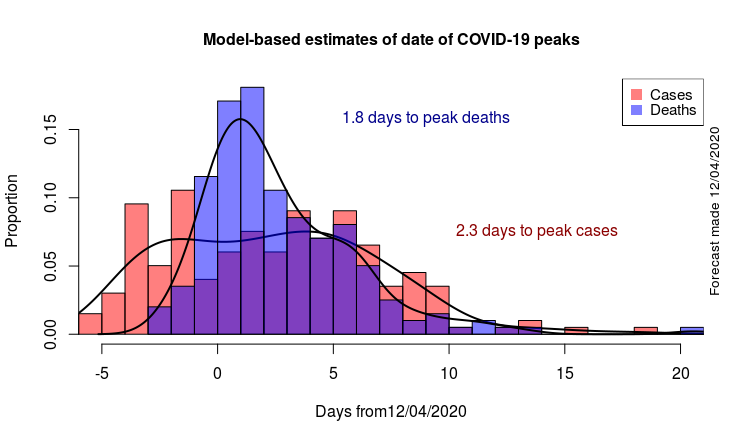
Histograms of estimated date of peak COVID-19 cases (red) and deaths (blue). Unlike in yesterday’s analysis the timing for the peak in new cases is poorly determined.
What a difference a single data point can make
The differences, from yesterday’s modelling, described above have been caused by just one new data point (of reported new cases). How reliable is that single data point? It is obviously critical that there has been no sudden jump in the measuring and recording methodology of new UK cases.
One advantage of using deaths (rather than cases) to predict future behaviour is that the deaths rate data are likely to be more consistent and more reliable. One disadvantage is that deaths lag new cases. However my analysis of the behaviour of COVID-19 in China, and in Italy and Spain, suggests the lag between reported deaths and reported new cases is minimal, typically only a few days.
Strategies for reopening the economy
It may seem strange to move on (as I do now) to looking into likely dates for reopening the economy when new cases of COVID-19 surged yesterday. Nevertheless the Hubbert-type analysis, or Clark-Thompson flowering-curve analysis, that I am carrying out lends itself well to a forward look. A simple idea would be to unlock the economy when the number of new cases and/or new deaths drops to the same level as were occurring at the time of lockdown. The histogram below plots the range of days (from present) to ‘unlock’ as based on this ‘lockdown equivalence’ principle.
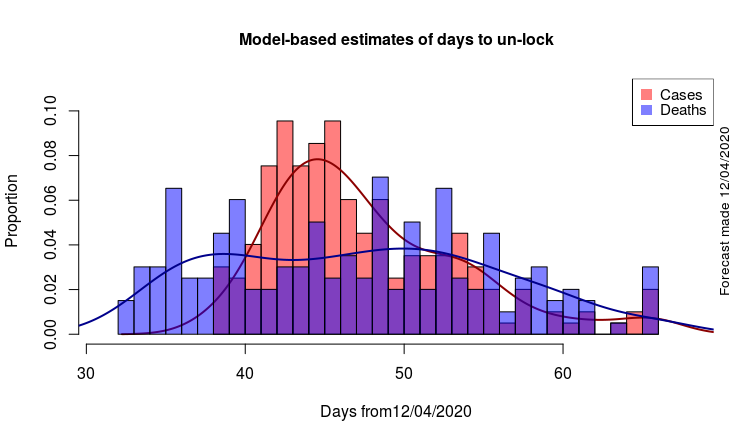
Histograms of estimated date (measured from today 12/04/2020) of when peak COVID-19 cases (red) and deaths (blue) will fall to the same level as when the strict national lockdown was first announced (17/03/2020). [NB The choice of lockdown date is critical in this analysis because the tails of the Hubbert-curve are so shallow.]
Scotland
An easily machine-readable daily deaths web-source continues to elude me. Interestingly the cumulative number of people in hospital with confirmed or suspected COVID-19 in Scotland has gone down (yes down!) by 100 since yesterday. Long may that trend continue! A really excellent, visually rich source of information is available at Scotland Coronavirus Tracker
Previous COVID-19 blog pages Part V , Part IV , Part III , Part II, Part I


Recent comments