
Covid-19 and traffic volumes in Edinburgh
Summary
The COVID-19 pandemic has strongly influenced almost every aspect of daily life, including road traffic patterns and transportation systems. Daily travel behaviour in cities all across thje world has been entirely reshaped due to COVID-19.
In Scotland traffic volume started to decline well ahead of the main stay-at-home order of March 23. By the time of the official start of lockdown traffic volume and had already dropped significantly. Several datasets (summarized below) demonstrate how volumes continued to remain at very low levels for several weeks.
COVID-19 provides a wonderful opportunity to study and to gain a clearer understanding of the relationship between reduced traffic congestion in urban areas and improved air quality. This unplanned ‘experiment’ will allow authorities to identify the congestion characteristics of their cities more clearly. It can provide a blue-print for better planning of health-improvement schemes, creating improvements in travel times for commuters and selecting the most appropriate physical measures to counter local traffic congestion.
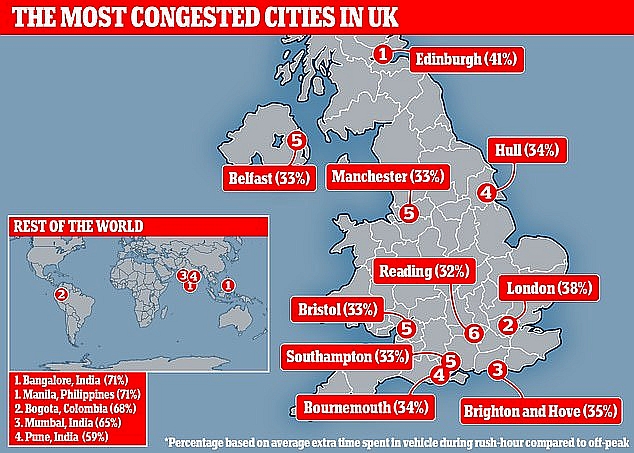
Source: MailOnline (). Map showing the location of the most congested cities in the UK, along with (inset) a map showing the most congested cities in the world
Background
Before describing the effects of Covid it is worth noting that Edinburgh is, for its size, the 4th most congested city in the whole world (cf. TomTom’s SatNav database). N.B. Congestion can be formally measured in many ways. Most fundamentally it is a function of a reduction in speed of travel. This leads to TomTom’s straightforward measure of the travel time as a proportion of that normally experienced under light or free flow travel conditions. On a national basis TomTom assess Edinburgh as the most traffic congested city in the UK – worse even than London and other well-known congestion hot spots such as Brighton and Hove, and Bournemouth.
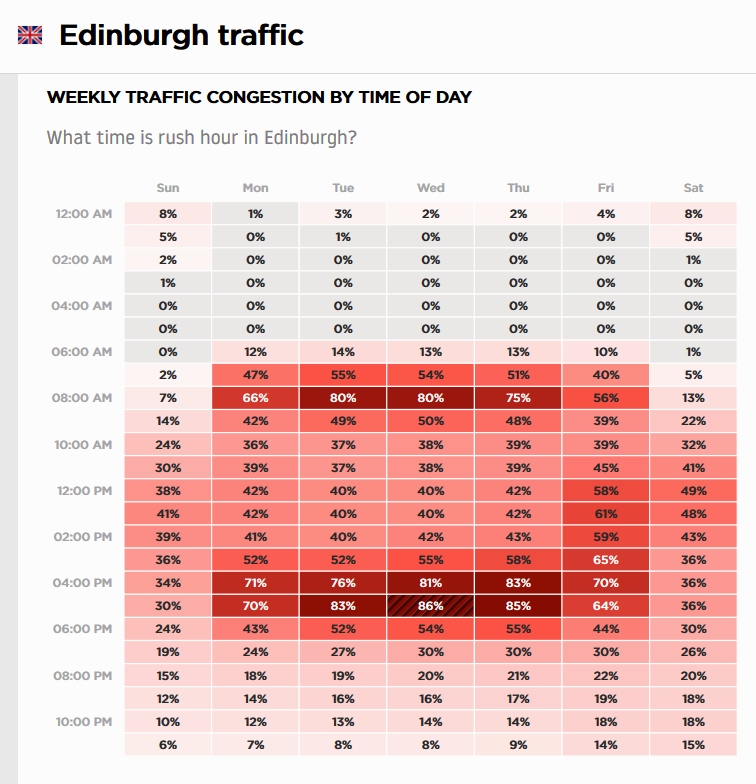
In Edinburgh weekday rush-hour journeys take some 80 to 85% longer than those at times of free-flow. (The worst time of all to travel is between17:00 and 18:00 on a Wednesday evening.) At peak, in the evening rush, a journey that typically takes just 30 minutes (at a quiet time) becomes 24 minutes longer and so requires 54 minutes. It is this high proportional increase in ‘lost time’ that causes Edinburgh to be so high in congestion league tables.
Glaswegians fair little better. The medical journal The Lancet ranks Glasgow as one of the most polluted parts of Britain, with roadside monitoring reglularly registering levels above World Health Organisation limits. Even Dundee has two air-quality monitoring sites that, even as recently as 2019, have been exceeding WHO advisory limits (>40 µg/m3 NO2).
Data
In order to assess reductions in traffic levels during the Covid pandemic I inspect three different sources of data: Transport Scotland, Apple’s COVID‑19 mobility trends, and TomTom International BV’s SatNav historical data.
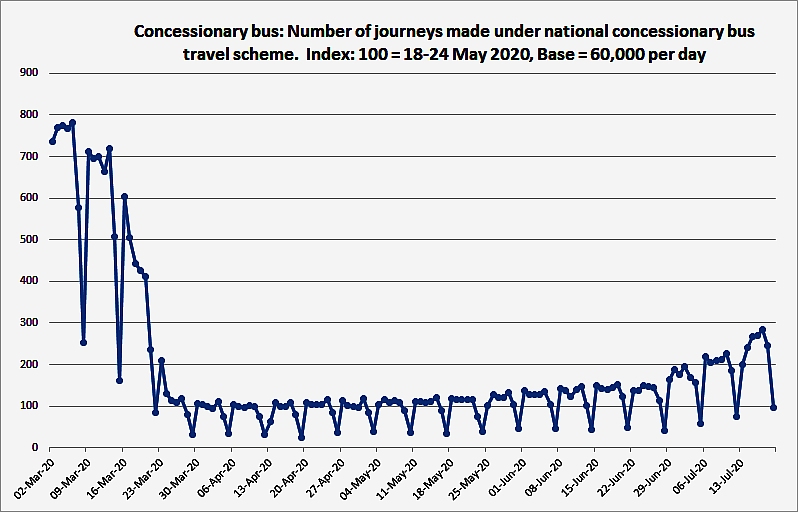
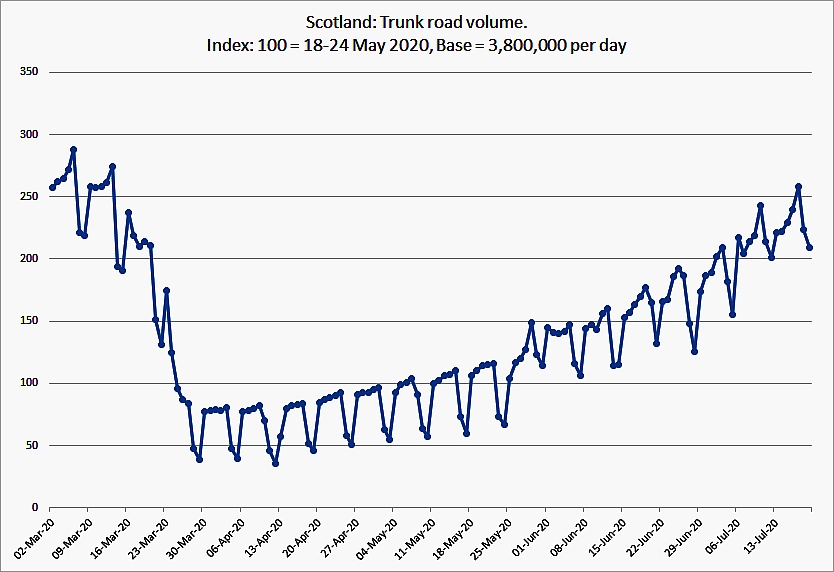
Beginning with Transport Scotland: the first two graphs below plot country-wide averages. They show how both concessionary bus travel and trunk-road traffic volume began to taper off two weeks before lockdown. By lockdown itself bus use had fallen by 88% across Scotland. Similarly trunk-road use had fallen -72%. The number of bus journeys remained very low for a further 14 weeks, only beginning to pick up again, and even then very slowly, in July. In contrast trunk road use began to recover (albeit slowly) within a couple of weeks. Its recovery accelerated somewhat (doubled) in June such that by mid-July the trunk-road usage index was approaching its normal level.
The distinctive weekend effect of low transportation on Saturdays, and especially on Sundays, can be seen in both data sets. Interestingly the weekend effect unambiguously continued throughout the Covid period. The dataset is very detailed. Close inspection even discloses peaking on Mondays and Fridays in both time series.
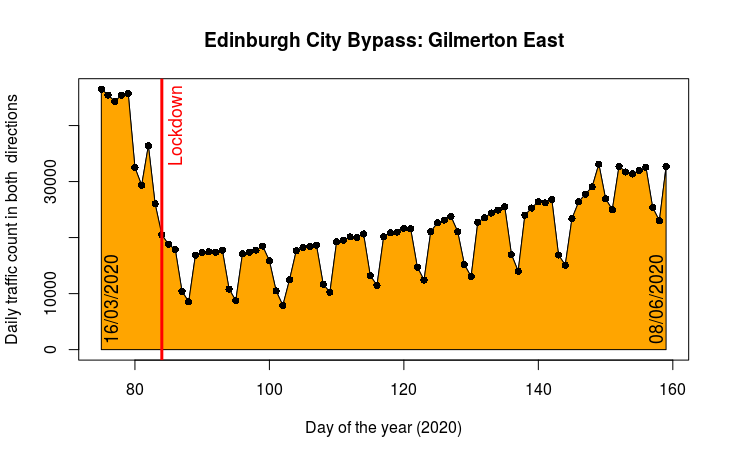
Very usefully traffic-volume data for Gilmerton East, on the Edinburgh City bypass, have also been released by Transport Scotland. I estimate a decrease of 63% of the pre-Covid volume at the start of lockdown.
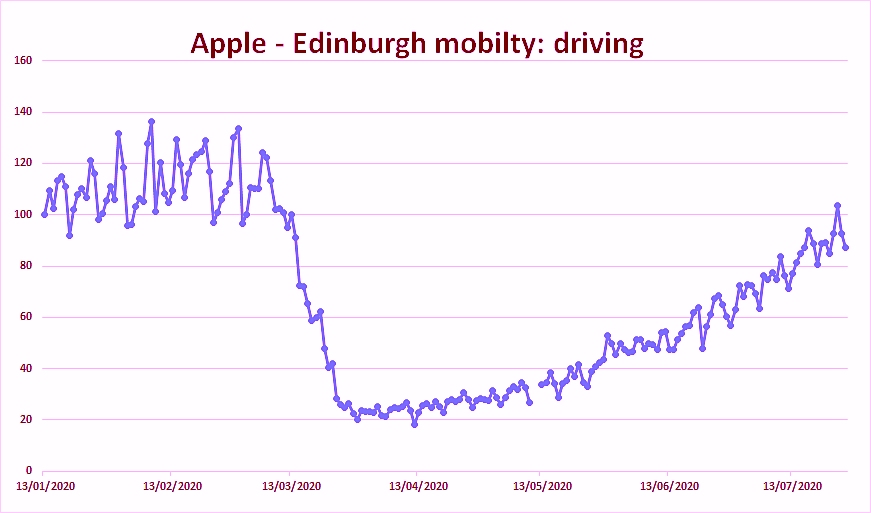
The fourth chart plots my second source of data, namely Apple’s mobility product. Their full product covers three aspects of mobility: walking, driving and public transport. The graph below is for driving alone. Apple assess driving mobility during Covid, in Edinburgh, as quickly dropping by 80%. The unusually low level can be seen to remain severely depressed for eight further weeks before beginning to recover more rapidly. By mid July the level was still 20% below pre-pandemic . Although it does not show an obvious weekend effect Apple’s driving mobility index for Edinburgh City otherwise presents many similarities to the Scottish trunk road index described above.
Finally I include four screengrabs to illustrate the type of extremely detailed data that are available from the transport specialist TomTom. TomTom have collected and archived a huge amount of fascinating traffic data from all around the world. Their database not only includes up-to-date traffic and travel information for real-time applications, but also forms the basis of an extensive historical Traffic Statistics database.
The screengrabs consist of three summary graphs and one table, all for the Edinburgh area. The Edinburgh data ‘cover all roads in Edinburgh open for road traffic’ (TomTom Traffic Sales Team, pers. comm.). Very helpfully TomTom compare and contrast the main Covid period with corresponding dates in 2019.
The first screengrab plots 2020 congestion data (in red) alongside comparable data for 2019 (in grey). A sharp and sustained drop at lockdown is once again easily recognisable. Looking more closely the data reveal that once the New Year celebrations had ended the traffic congestion index retuned to close to average. The TomTom congestion index can be seen to have continued at normal levels through to mid March (week 11). Then a decline began as the index dropped slowly at first and then more sharply at lockdown. The weekend effect continued throughout the Covid pandemic period but in a much reduced form. The weekday traffic index fell by around 75 to 80%, whereas at weekends traffic times fell by only 65 to 70%.
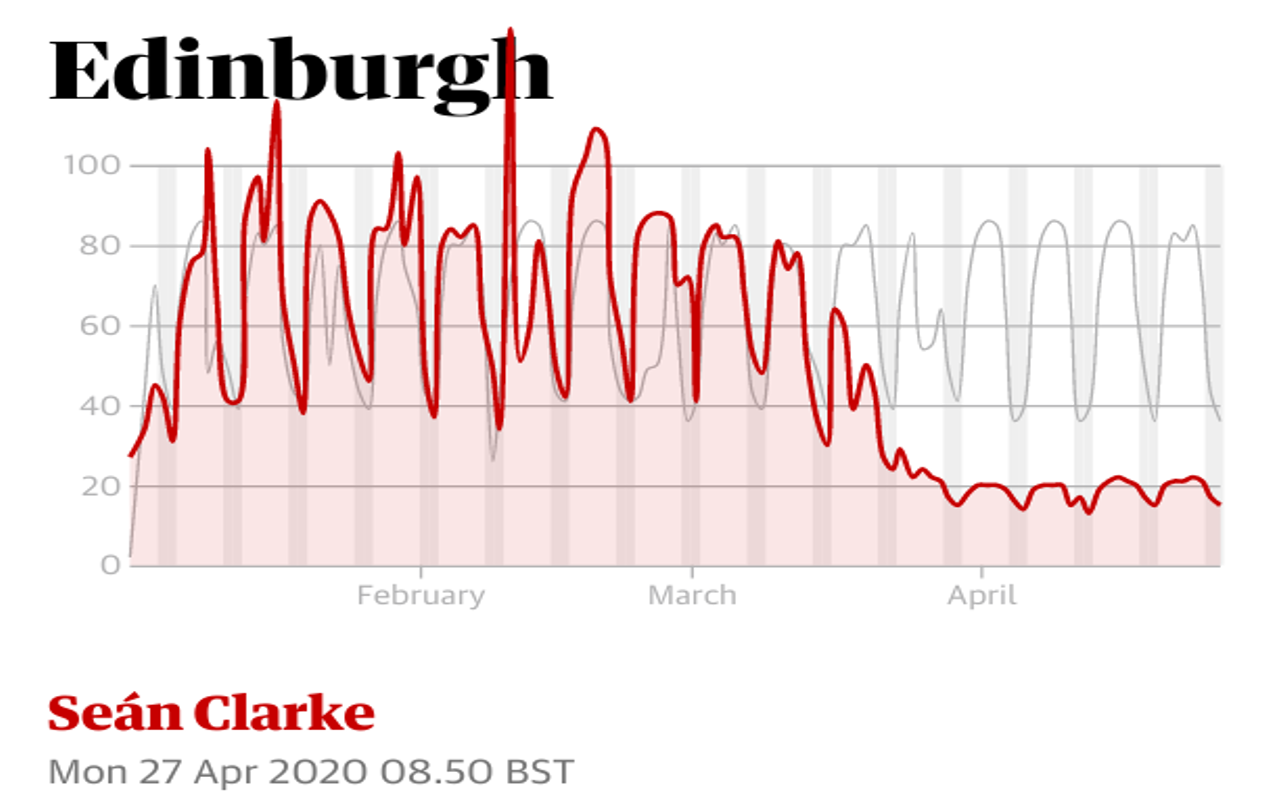
Source: TomTom International BV
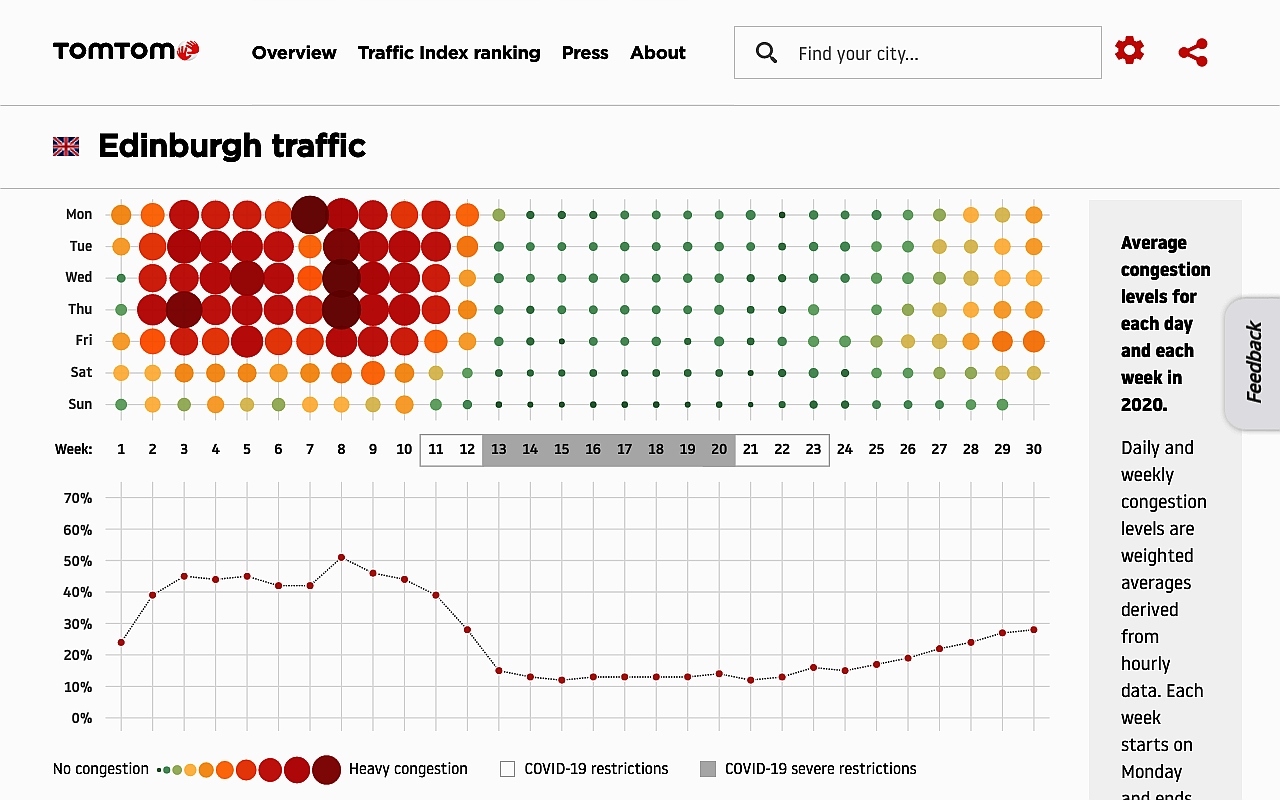
The second screengrab charts average congestion each day, starting on 1 Jan 2020. The day-by-day circles are colour coded from green (no congestion) through orange to red (heavy congestion). In Edinburgh fourteen weeks with very low congestion (i.e. short travel times) are readily apparent.
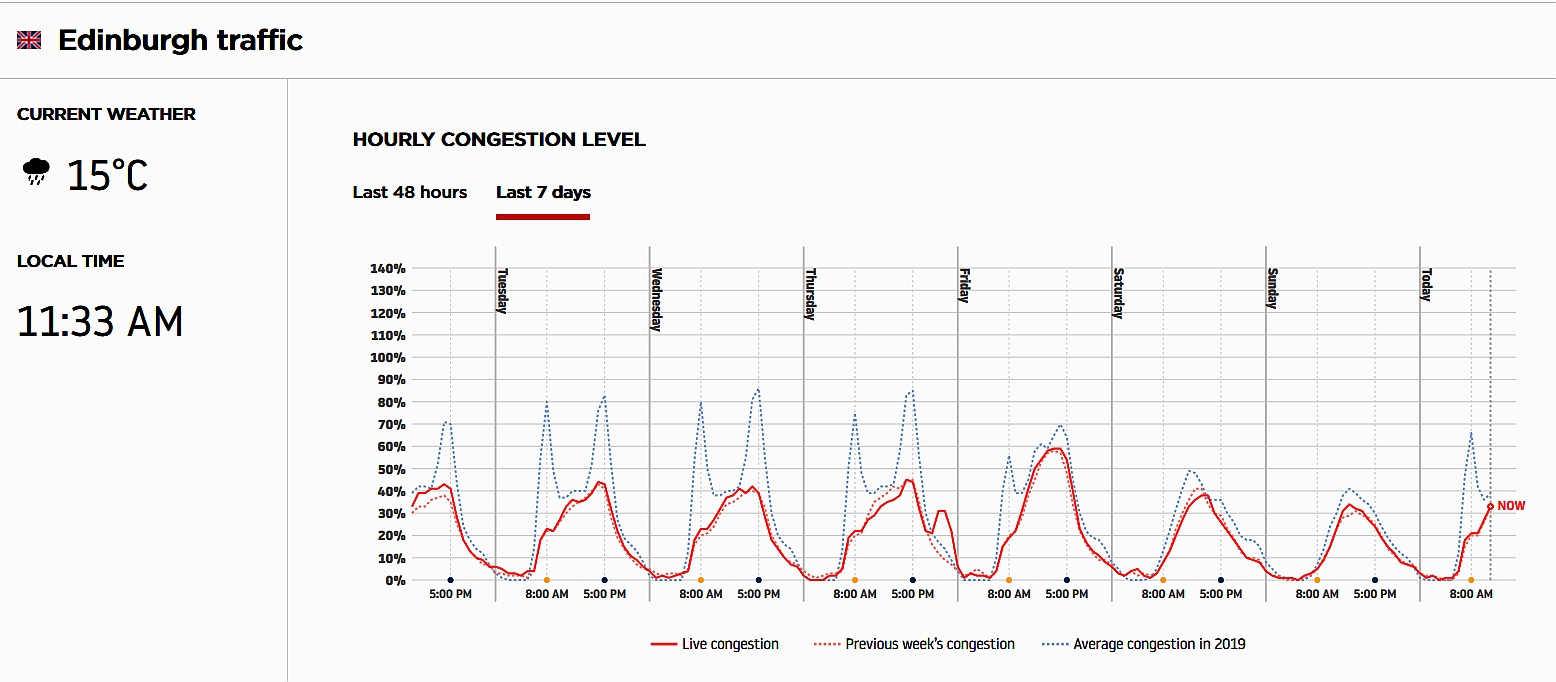
The third screengrab focuses on the travel-time data for the last seven days. It plots congestion levels as a red curve. Even by the end of July the usual twice daily rush-hour congestion pattern (grey) had still not resumed. Instead travel times are seen to peak in the middle of each day, intriguingly with a small secondary peak on the evening of Thursday 23 July. Little recovery is revealed compared to the time series for the previous week (orange dotted curve).
The final screengrab details Edinburgh’s normal traffic pattern on a daily basis, for each hour of the week. The table is both colour coded and tabulated as percentages. The longer journey times, especially on weekdays, are readily apparent. More specific details such as the earlier start to the Friday rush are nicely quantified in the TomTom summary table.
Interpretation
In broad terms the three Scottish data sets all tell the same story. Once the New Year celebrations had ended traffic levels returned close to average. This level of activity continued through until mid-March (week 11) when the impact of Covid first began to be felt. After the seriousness of the Covid situation became apparent (even to politicians at Westminster) and the stay-at-home guidance was officially (finally) issued, lockdown traffic movement all across Scotland fell more strongly to around -75% with only essential movements taking place. Traffic flow only recovered slightly over the ensuing 14 weeks. Even by the end of July it still had a long way to go in order to recover fully.
While the mobility changes across Scotland have been very pronounced, vehicle movement data from larger cities from many other parts of the world (Madrid, Paris, Rome, Boston, Sao Paulo) have revealed even larger declines (80 to 90%). Chinese cities (e.g. Shenzhen, Chengdu, Shanghai) saw even more dramatic falls (95%), on account of the enforced, but very successful, social distancing and internal travel restrictions. However these only persisted for a relatively short time span (5-6 weeks).
In Africa, cities such as Johannesburg and Cape Town experienced very similar mobility patterns to those in Scotland. They experienced falls of around 75% which have persisted (as of end-July) for 15 to 17 weeks.
Sweden followed a different strategy to that of most other countries. In Gothenburg and Malmo the TomTom Travel Time Index only fell around 55% and remained low only for about 4 weeks. Malmö, for example, had no lockdown (the spread of the virus was very low in Skåne). Again the TomTom data are very detailed. For Malmö, for example, they recorded that unusually low travel times reappeared once again in week 29, six weeks after levels had fully recovered. It transpires this is exactly the week when many people had already left the city to visit their summer houses out in the countryside for their summer holidays.
Big Data
This is a boom time for big data and the “internet of things”. In recent years an astonishing range of new datasets has become available. Some of these datasets are being made easily available across the web. Many are absolutely vast and have become known as ‘big data’. A good example concerns traffic and transport. The fusion of urban data from increasingly complex networks of mobile sensors with accurate geolocation software is aiding enhanced transport capability on a daily basis. Hundreds of millions of connected devices are measuring and tracking transport movements all around the world 24/7.
These novel systems have allowed mobility changes associated with the Covid pandemic to be examined in previously unimaginable detail. At the same time air quality has been recorded by networks of automatic measuring stations. These coninued to collect and analyse gas samples during Covid. The continuous running of these networks has allowed pollution changes through the pandemic to be mapped in great detail.
As traffic volumes reduced all across Scotland air quality greatly improved. Of course, pollution levels are influenced by many other factors in addition to traffic volume – especially by the weather and by long-distance chemical transport.
In Conclusion
It seems inconceivable that improvement in air quality during Covid was not strongly influenced by the reduced volume of road traffic.
Table: Declines during Covid-19
| Region | Index | Covid
decline |
| Scotland | Concessionary bus | -88% |
| Scotland | Trunk roads | -72% |
| Edinburgh | Apple traffic mobility | -80% |
| Edinburgh | TomTom travel times | -75% |
| Edinburgh | Bypass (Gilmerton East) | -63% |
| Edinburgh | St John’s Rd. & Nicolson St. (NO) | -78% |
| Edinburgh | St John’s Rd. & Nicolson St. (NO2) | -62% |
Two remaining questions are:
- how tightly do changes in air quality and traffic volume correlate through the Covid disruption?
- what congestion and air-quality improvements do the Covid data suggest would likely ensue from the establishment of low-emission zones in Scottish cities?
Visit forthcoming blog postings for answers to these questions!


Recent comments