
COVID-19 and the Edinburgh congestion charge VIII
Air pollution plunges by up to 80% in Scotland’s city centres during the Covid pandemic
Summary
During the COVID-19 lockdown huge reductions in nitrogen oxide pollutants (up to 80% for NO, 66% for NO2) took place across Scotland’s cities and towns. Particularly pronounced declines are found for sites normally dense with road traffic. In contrast rural, exurban and suburban locations show little change. Road-traffic intensity during Covid also declined massively. Such Covid-induced changes can be treated as a grand ‘natural experiment’ and capitalised upon to estimate the beneficial effects of any future road-pricing schemes (e.g. the proposal for a low emission zone in Edinburgh) on improved air quality, health gains and shorter journey times.
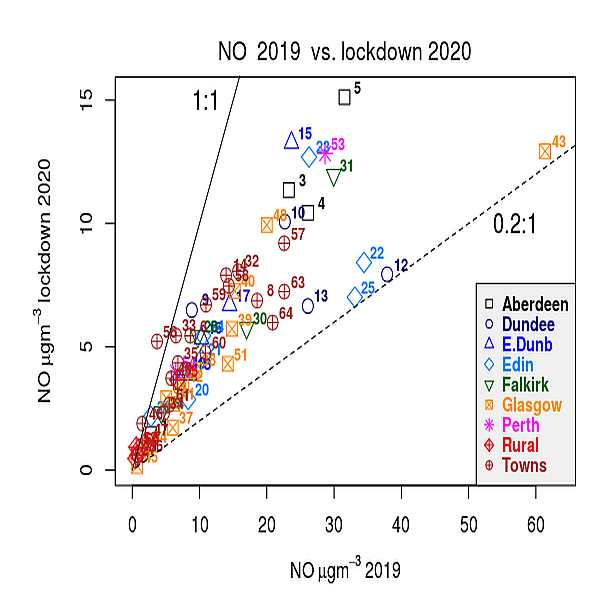
Pollution during the Covid period (horizontal axis) vs. pollution during the corresponding period in 2019 (vertical axis). City centres and towns, ranging in size from Glasgow to Cupar, show major reductions due to lowered road-traffic emissions. Rural sites (Eskdalemuir, Bush estate, exurban and suburban areas) display smaller changes. Solid 1:1 line: no change in pollution between 2019 and 2020. Dashed 0.2:1 line: 80% reduction in pollution. See Table below for site numbers and further details.
Air pollutants
All air-quality data were obtained from the Scottish Air Quality Database (as delivered by Ricardo on behalf of the Scottish Government). N.B. Measurements after 01/04/2020 01:00 are, to date, only provisionally verified and may be subject to future revision.
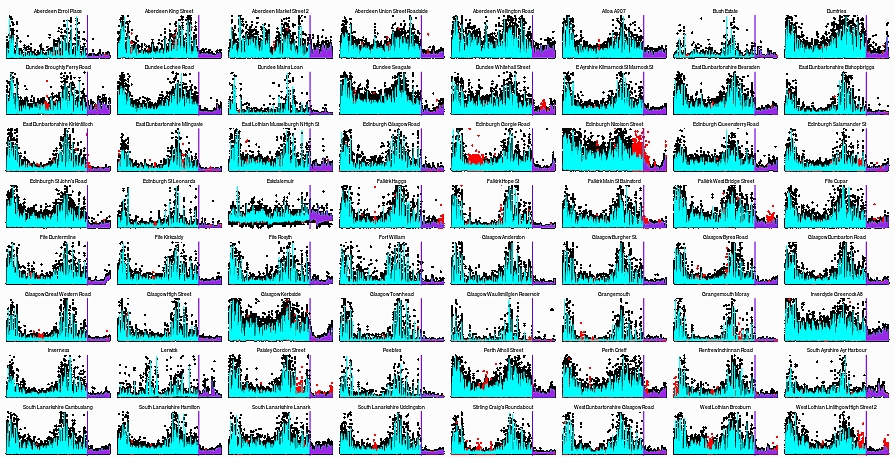
Nitrogen monoxide at 64 sites across Scotland. Each time series plots hourly NO levels from 01/01/2019 to 22/07/2020. Black: observations. Red: imputed missing data. Cyan: smooth (robust) fit to measured concentration data. Purple: fit during Covid lockdown period. Note how essentially all sites show lockdown reductions in comparison to the corresponding period in 2019. Note the annual cycle and peaks of high wintertime concentrations and low summertime values. These seasonal differences relate to the thickness of the boundary layer (the lowest part of the atmosphere where vertical mixing is strong). It is generally shallowest during the day in winter.
Data processing
A total of 1,215,384 measurements of nitrogen oxide (NO) at 89 automatic air-monitoring sites were obtained for analysis. Sixty-four of the available sites were selected as having over 73% data coverage. This subset provided 839,867 data points at hourly intervals between 1 Jan 2019 and the analysis date of 22 July 2020.
The 64 time series were processed in three steps. First data drop-outs (3.9% of the total) were filled. The popular k-nearest neighbour (KNN) algorithm was used to predict missing values (red dots in Fig 2). This “nearest neighbour imputation” approach was easily programmable. It works by averaging similar cases (hours) from elsewhere in the time series. It involved just one line of R code Y <- knn.impute(data, k = 10).
Next any isolated spikes and aberrant measurements were removed. Numerous modern smoothing and filtering techniques are available for the task. Several procedures allow extraction of a signal from noisy univariate or multivariate time series by applying robust regression techniques to a moving time window. Repeated-median regression as well as hybrid and trimmed filters which allow automatic outlier replacement were tested. However they were all found to be less effective, more mathematically unstable or even intractable in comparison with “classic” median smoothing techniques first pioneered in the 1970s by the indefatigable John Tukey. Consequently his running-medians method was employed. This basically provides as robust a scatter plot smoothing as possible. I used a median window width of 5, namely the R-command runmed(y, k = 5, algorithm=”T”) at all sites.
Finally mean nitrogen monoxide levels were tabulated for the first 121 days of lockdown (24 March to 22 July, 2020) and the corresponding 121 days in 2019. In addition an exactly equivalent set of procedures was followed for nitrogen dioxide. (See figure below.)
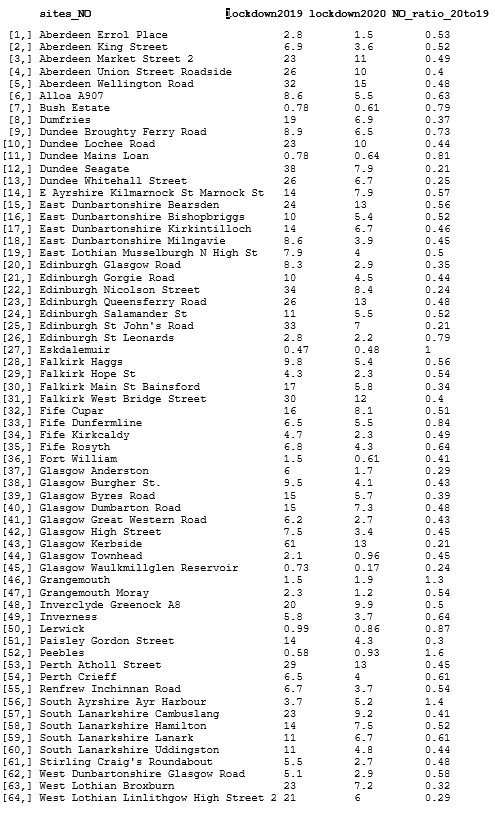
Table: Summary of NO concentrations (µg m-3) at 64 air-quality sites during lockdown 2020 and in 2019.
Results
Air quality can be seen to have greatly improved throughout the Covid lockdown period. The start of this unprecedented recovery coincided with the beginning of lockdown (week including 24 March 2020). High air quality continued for many weeks, only deteriorating when traffic density built up again (end July 2020). The effect is strongest for normally busy city-centre streets and for nitrogen monoxide (the primary traffic-exhaust pollutant).
|
Site |
Average reduction of NO |
Average reduction of NO2 |
|
City centres & kerbsides |
80% | 66% |
|
Towns, exurbs & suburbs |
50% | 45% |
|
Rural & small settlements |
30% | 25% |
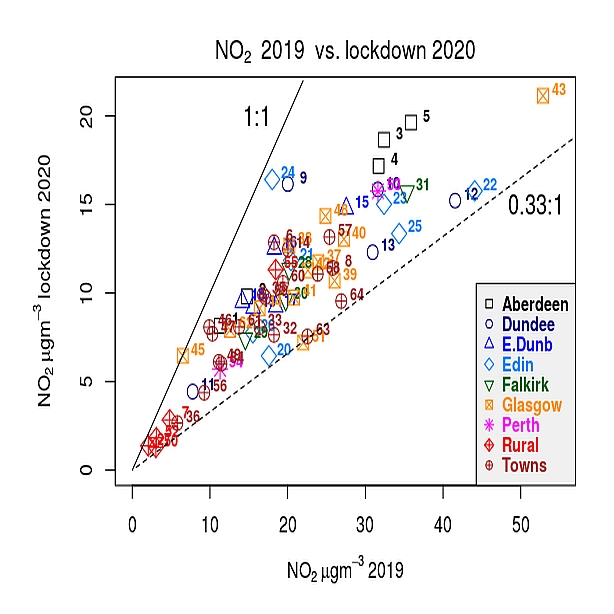
NO2 pollution during the lockdown period vs. pollution during the corresponding time period in 2019. As for NO, city centres and towns show major reductions due to reduced road-traffic emissions. Rural sites (Eskdalemuir, Bush estate, suburban areas) display small changes. Dashed 0.33:1 line: pollution levels reduced by two thirds.
Silver lining
The COVID-19 pandemic has in a matter of weeks fundamentally crippled health systems in many countries and is threatening a global economic depression. However, one positive comes from the one-off opportunity it provides of performing a natural experiment which can be used to study air quality. The pandemic has resulted in the greatest restrictions in travel in human history. This change has led to very substantial reductions in ambient nitrogen monoxide and nitrogen dioxide levels, and to a lesser extent in particulate matter. Such reductions, if continued, would have major positive impacts on population health, particularly in highly polluted streets. Since different industries and pollution sources shut down to different extents (see next blog post) the study of local air pollution can help us to better understand which pollutants are coming from which sources. In turn this new knowledge can guide us towards the best strategies to improve air quality when the pandemic is over (see fothcoming blog postings).


Recent comments