COVID-19 How many global deaths will COVID-19 cause?
How many global deaths will COVID-19 cause?
In a recently published paper (Autumn 2020 issue of The Edinburgh Geologist, pp9-16) Professor Roy Thompson shows how he applied a geomathematical technique to forecasting the likely number of deaths from COVID-19. This tried and tested approach has been extensively used previously with great success by energy-modellers and geologists.

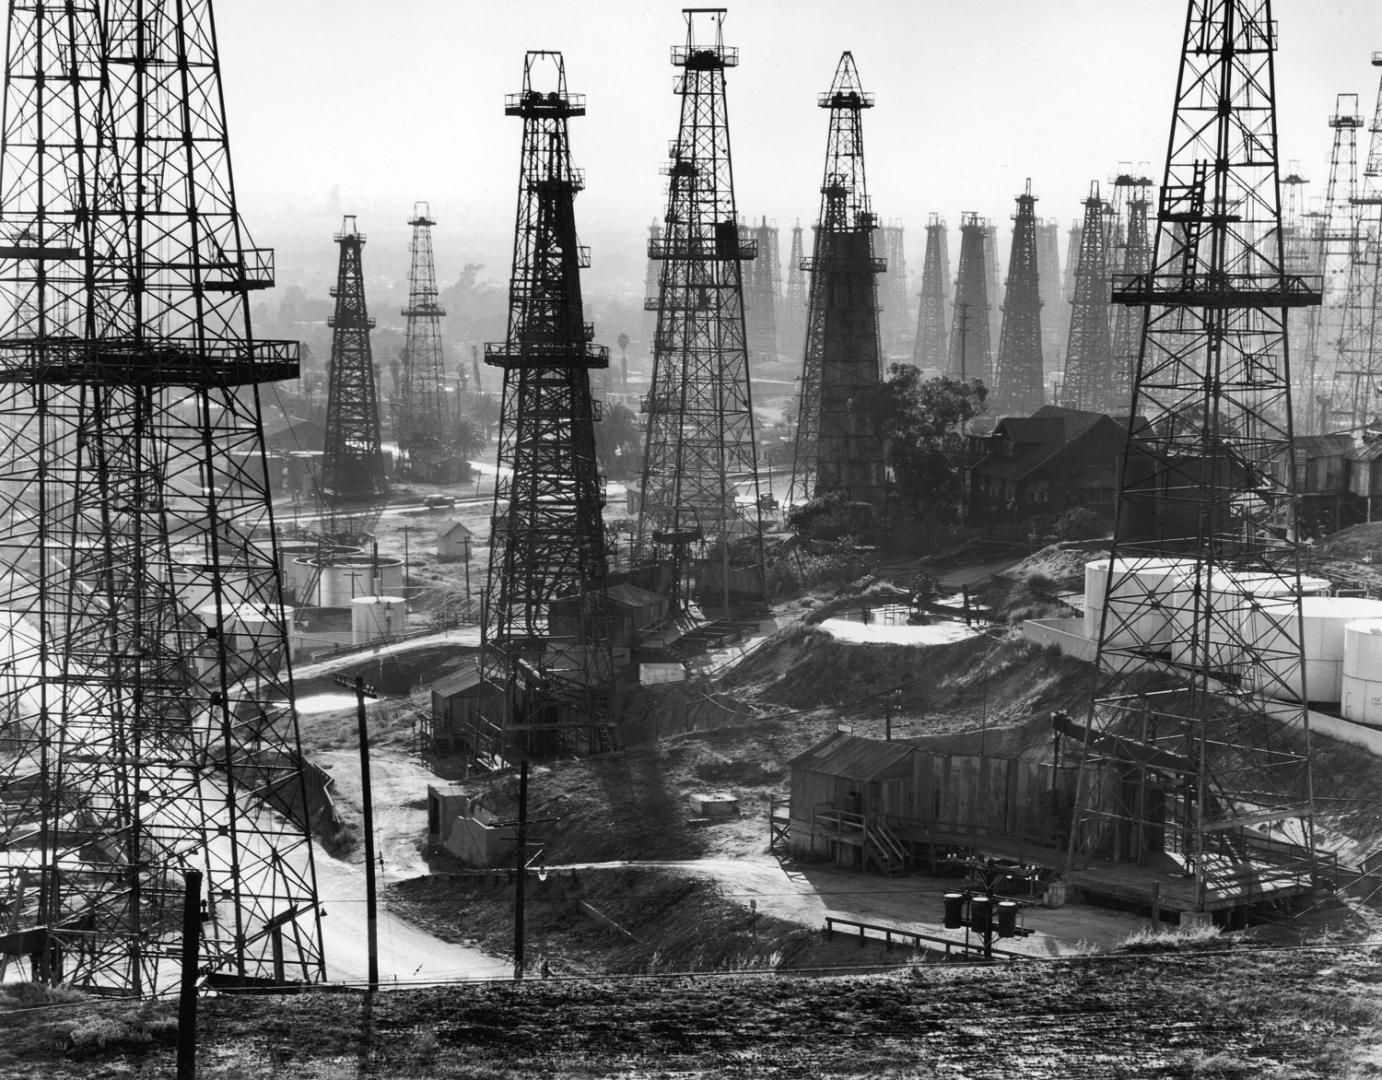
Signal Hill Oil Field in California, astride a classic anticlinal structure, was enormously productive in the 1950s before peak-oil began to take its toll in America.
The method was originally developed by King-Hubbert: an oil geologist variously described as a maverick, a genius anda visionary. In the 1950s Hubbert gained fame by using his method to make a bold prediction — that, contrary to conventional geological wisdom, oil production in the USA would soon reach its zenith and then quickly decline. His basic idea was that oil resources follow a bell-shaped production curve. Hubbert’s forecast proved to be very prescient and his curve-fitting approach has since been successfully applied to oil provinces from all around the world.
Roy’s work on this fast-moving topic of SARS-CoV-2 was carried out during lockdown and is described in a series of University blog pages starting on 6 April 2020.
As a first, very preliminary, estimate (7 April 2020) his curve-fitting produced an evaluation that the first wave of COVID-19 could well claim 1.5 million lives worldwide. Today (2 Oct 2020, as this text is being written) it is salutary to note that global deaths crossed the agonising milestone of one million people dead three days ago (data from Johns Hopkins University).
The key finding of Roy’s analyses was that expected deaths (per capita) varied widely between countries. Nonetheless the time-series of deaths in each country followed a bell-shaped path. Consequently each could be extrapolated in exactly the same way as for Hubbert’s forecasts of oil production.
The geo-maths proved to display good ‘skill’ and to be able to make early forecasts. For example as late as 27th April the UK government was still claiming the UK was not past peak-COVID and it was far too early to compare between countries. They instead chose to maintain that any such comparison, while the crisis was still unfolding, was ‘premature’. Instead Hubbert’s maths were way ahead of the game and already demonstrating distinct between-country differences as early as late March and forecasting peak-COVID in the UK several days before it occurred during the week ending April 17th.
Countries that acted swiftly, that adopted stringent social distancing, that chose firmly and rapidly to put travel restrictions into place and that rigorous implemented public-health measures to prevent viral transfer to the vulnerable had far fewer deaths. They also returned more easily to free internal movement and achieved a rebounding economy more speedily. Tellingly many of these nations have female leaders.
……………………………
Peak oil, flowering curves and the COVID-19 pandemic by Professor Roy Thompson, Autumn 2020 issue of The Edinburgh Geologist, pp9-16.


Recent comments