Any views expressed within media held on this service are those of the contributors, should not be taken as approved or endorsed by the University, and do not necessarily reflect the views of the University in respect of any particular issue.

COVID-19 and the Edinburgh congestion charge VI

St John’s Road pollution Jan to April 2020: removing local meteorological effects.


First attempt at ‘deweathering‘ St John’s Road pollution Jan to April 2020, i.e removing local meteorological effects.

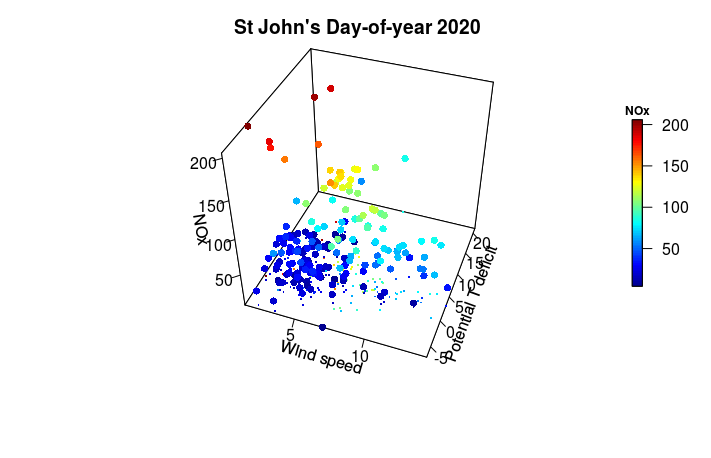
Wind speed and direction plus temporal effects (daily, weekday, seasonal cycles) can account for 64% of the variation. The 3D plot aims to improve on that relationship by including local lapse rate / boundary layer paameters derived from the CMIP5 reanalysis product.

The aim is to quantify the effect of reduced traffic-flow during the COVID period on pollution levels and hence assess the benefits of the introduction of a congestion / low emissions scheme on local pollution and public health.

Leave a reply

You may use these HTML tags and attributes: <a href="" title=""> <abbr title=""> <acronym title=""> <b> <blockquote cite=""> <cite> <code> <del datetime=""> <em> <i> <q cite=""> <s> <strike> <strong>

css.php

Report this page

To report inappropriate content on this page, please use the form below. Upon receiving your report, we will be in touch as per the Take Down Policy of the service.

Please note that personal data collected through this form is used and stored for the purposes of processing this report and communication with you.

If you are unable to report a concern about content via this form please contact the Service Owner.

Please enter an email address you wish to be contacted on. Please describe the unacceptable content in sufficient detail to allow us to locate it, and why you consider it to be unacceptable.
By submitting this report, you accept that it is accurate and that fraudulent or nuisance complaints may result in action by the University.

  Cancel