Glimmer of hope III
Is the UKs COVID-19 peak in sight? Yes!
Part III of Glimmer of hope. (9-April-2020) Part II
Summary
In short, peak COVID-19 can indeed now be glimpsed.
Background
The pioneering petroleum-supply authority M. King Hubbert refined his forecasts of peak oil by a clever strategy. He noted that oil production lagged behind oil discoveries by a ten years. That is the time it took to develop and bring large oil fields into production. So when Hubbert found that the rate of discovery of new oil fields (onshore USA) had started to decline he was able to forecast that peak oil was only ten years away. By way of contrast conventional wisdom of the time believed (incorrectly) that US crude oil would remain virtually unlimited.
Can a similar Hubbert-type strategy be used to glimpse the peak date in COVID-19 deaths? And can that date be quantified?
Italy
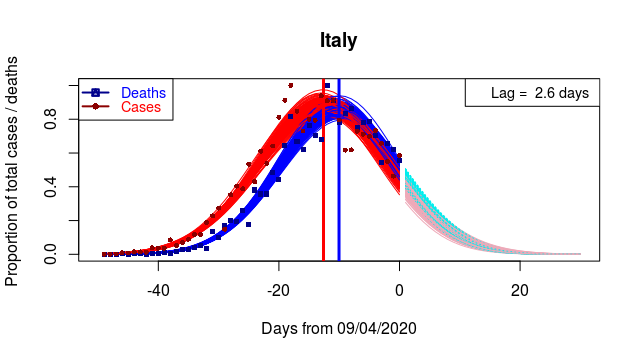
A comparison of new cases with daily deaths reveals a useful association. The peak date of new cases (red) precedes that of deaths (blue). Furthermore Hubbert-type maths allows the time lag to be quantified as 2.6 days.

The swathe of light coloured curves (at the right) are my forecast of how new cases (pink) and deaths (cyan) will play out in Italy.
Spain
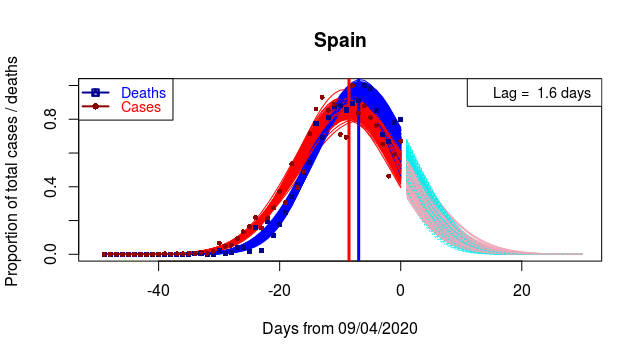
Can the above Italian analysis be validated? Yes, to some extent. New cases in Spain also foreshadowed deaths. The calculated difference in timing of the two peaks in Spain was shorter, at only 1.6 days, than in Italy. Perhaps the monitoring and recording systems were somewhat different in Italy and Spain. NB, both the Italian and Spanish graphs show how the rate of decline closely mirrored the rate of increase.
Netherlands
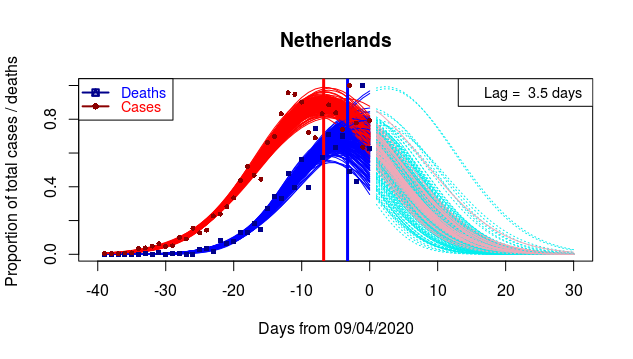
COVID-19 has not penetrated as far into the Netherlands as into Italy or Spain. In the diagram below, my forecast still shows a wide spread of potential trajectories for deaths (cyan), while for new cases (pink) the spread is much more restricted. Interestingly although the death trajectory lagged that of the new cases trajectory by around 10 days during the rising phase, the model places the two peaks as being separated by only 3.5 days.

United Kingdom
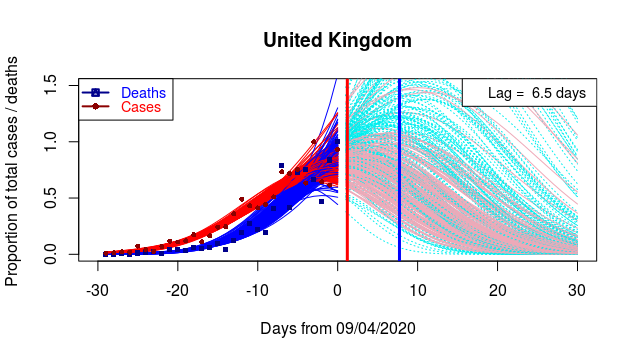
Who knows how the measurement of new COVID-19 cases in the UK compares with that in other European countries? Nevertheless given the above three examples, an analysis of new UK cases might be revealing. If a peak in new cases could be glimpsed then the peak in deaths might not be too far behind. That is, a Hubbert-type analysis of case numbers could be useful for planning the future management of COVID-19 in the near future. 
As expected, uncertainties are high. The forecasts show much spread. Nevertheless the model puts the peak in new cases only a couple of days away. And if that is true, given the above three examples, peak deaths should be only a few days behind. Thus Hubbert analysis currently points to peak COVID-19 deaths as most likely arriving in 8 days’ time.
Blog will continue here tomorrow


This is a fascinating analysis – and if right, very encouraging.
Thanks. The analysis should update daily.
Very interesting, and hoping you’re correct in most regards. I agree with most of your statistics, hypothesis, projections and statistics. The only real difference is that I don’t know what I’m talking about, and you DO!!
Well done with your presentation.
Let us hope we all make it through and return to some kind of normality (albeit a slightly different world) sooner rather than later!!
Stay safe and well.
Ross, Many thanks. I’m used to predicting what will happen with climate change over the next 100 years. So its quite challenging trying to predict COVID-19 over the next week or so. Time will soon tell how close I was to glimpsing the peak.
Glad you’ve predicted that we have 100 years left!
Absolutely fascinating. I look forward to checking your predictions. Many hanks. Bob
Bob, I too hope I will still be here in a week’s time to check. My daily updates can be found at
https://blogs.ed.ac.uk/roythompson/posts/