Any views expressed within media held on this service are those of the contributors, should not be taken as approved or endorsed by the University, and do not necessarily reflect the views of the University in respect of any particular issue.
Digimap is an online map and data delivery service, available by subscription to UK Higher and Further Education establishments. Operated by EDINA at the University of Edinburgh, Digimap offers a number of data collections, including Ordnance Survey, historical, geological, aerial photography, LiDAR, marine maps, land cover mapping, global mapping and census data. For more information about Digimap go to our website: https://digimap.edina.ac.uk Background image Contains OS data (c) Crown Copyright and database right 2022
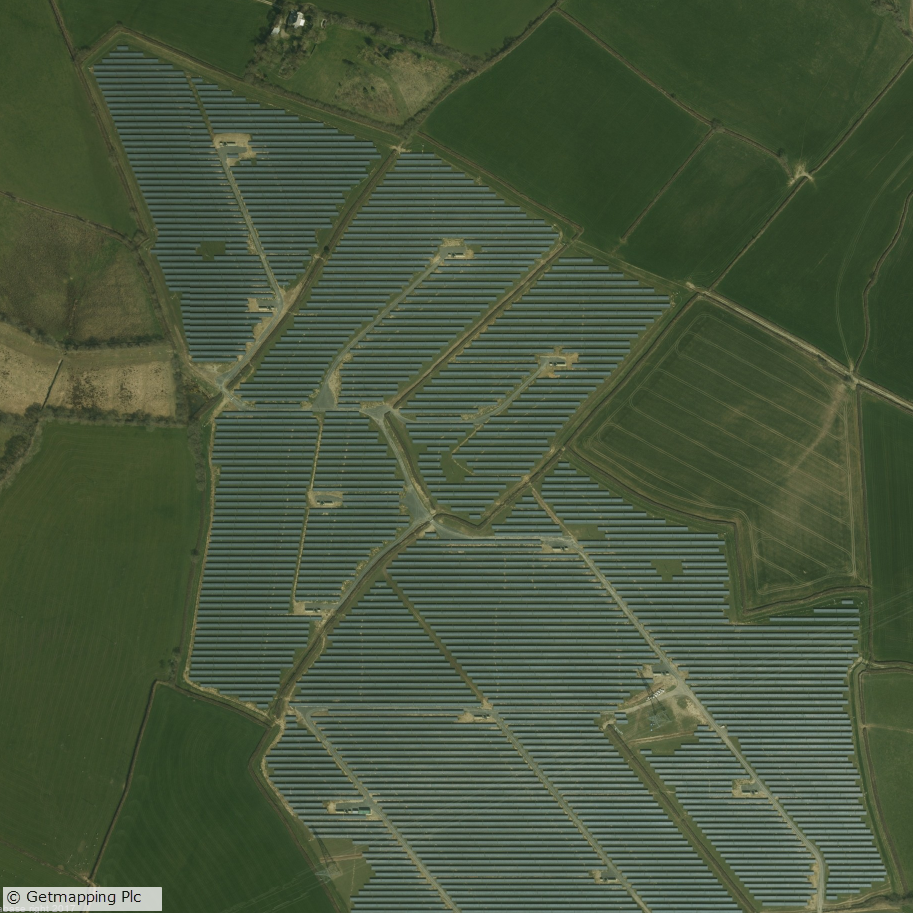
Canworthy Solar Farm, which became operational in 2014 and covers approximately 55 hectares (~67 football fields)
Aerial Digimap updates
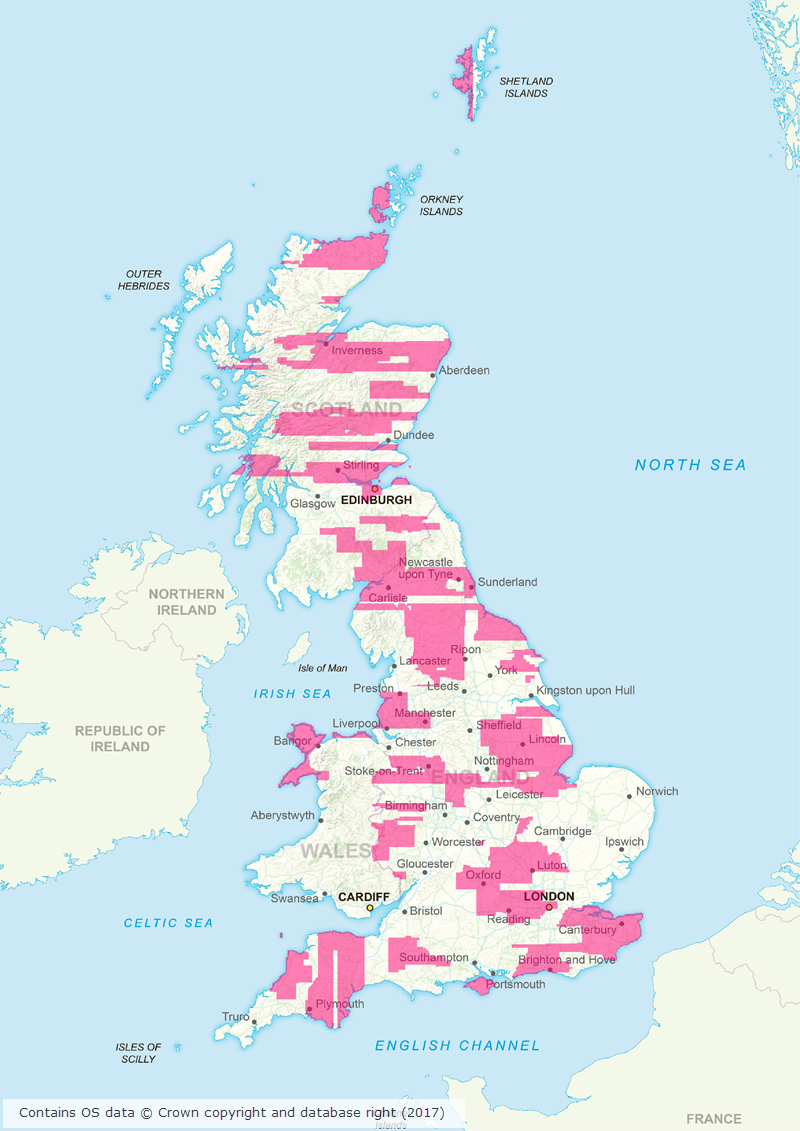
March/April 2017 has been a busy couple of months for the Data Team who have been working hard to process a huge area of updated aerial imagery data from the data supplier, Getmapping. The update consists of around 80,000 individual 1km tiles, all captured in 2015, which is approximately 30% of the country.
Prior to the update just over 50% of the data was from 2013 or later; after the update 77% of the data is from 2013 or later.
This means that more up to date imagery is now available for viewing and download through Aerial Digimap for a significant proportion of the country.
The map below shows the approximate distribution of the updated data.
Click on map to view larger version
This is the first update we have received from Getmapping, but we are expecting another update later this year containing imagery captured in 2016.
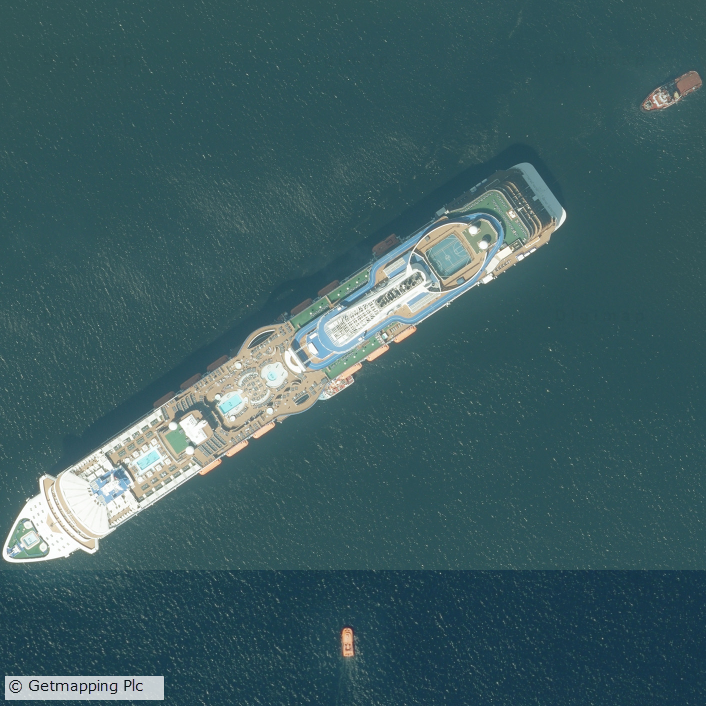
Cruise liner in the Firth of Forth
We will add this to the service as quickly as we can to ensure that the most up to date data is always available to Aerial Digimap users. In order to make it clear where the data has been updated, we will add an Availability/Reference Grid to Aerial Download so that users can easily identify if the imagery has been updated in their study area(s). This grid will be added to the system in the next couple of weeks.
We are still investigating the best way to make previous versions of the data available, but in the mean time only the most recent data is available through Aerial Roam and Aerial Download.
Webinar resources
We recently ran a webinar highlighting the data and showcasing a number of potential uses for the imagery. The webinar was recorded in full and is available on our YouTube channel. The slides used during the webinar and a transcript of all questions and answers are available on our help page.
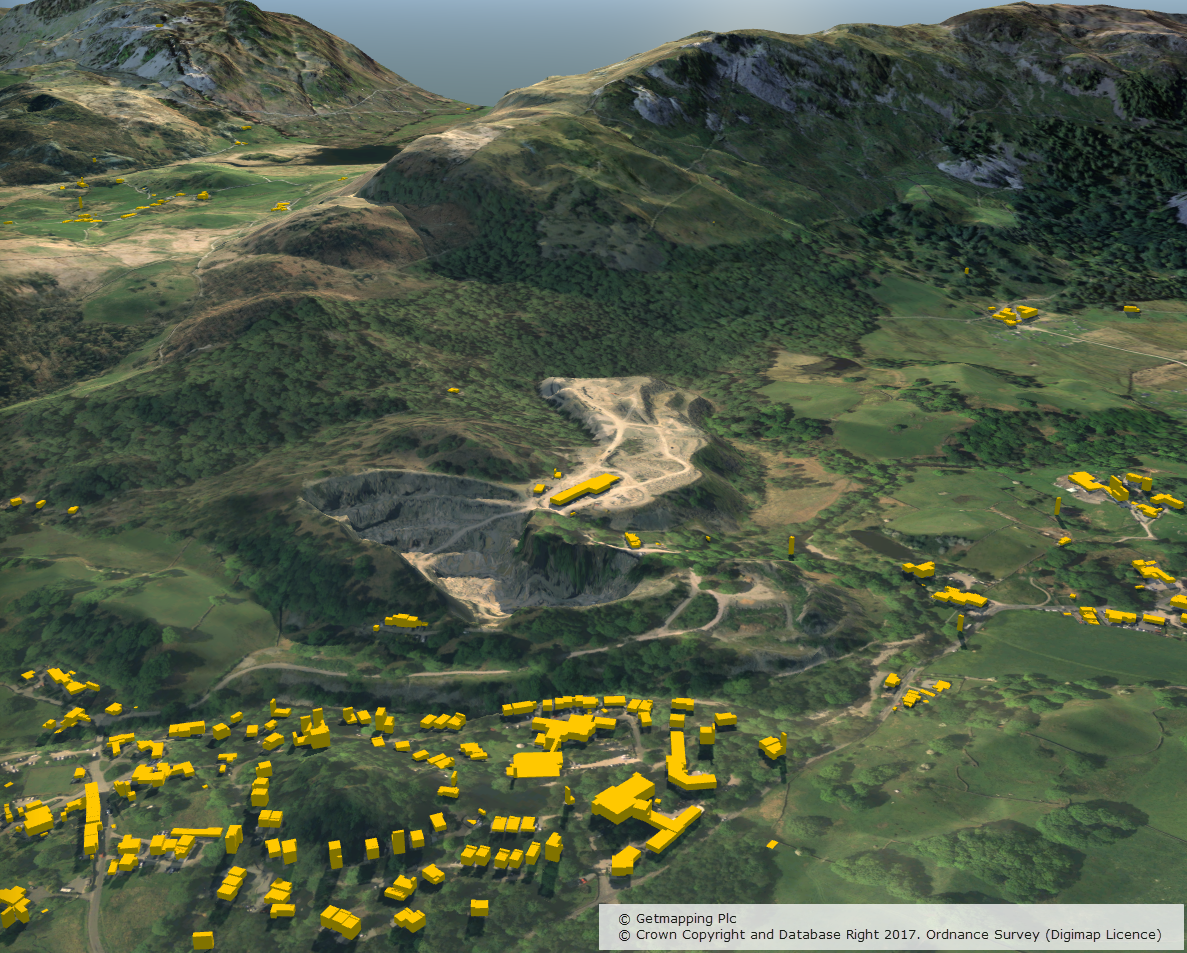
3D model using Aerial Imagery, OS Terrain 5 DTM and MasterMap Building Height Attribute
Data information
The aerial imagery data in the service is 25cm resolution vertical aerial orthophotography supplied by Getmapping PLC, and is the most detailed aerial imagery available for the whole of Great Britain. As well as being a really interesting dataset the imagery also has a number of practical uses across a wide range of disciplines from urban planning and 3D modelling to land use and archaeological studies.
Subscribing
To see if your institution already subscribes to Aerial Digimap, please see our subscribing institutions help page. Information on how to subscribe to the new service is available on the Aerial Digimap Subscription page.
If you have any questions about the service please consult the dedicated Aerial Digimap help pages or contact the Digimap support team using the details below.
Dataset updates in Ordnance Survey Digimap
OS Data Download:
Product Name
OS Publication Date
Code-Point
February 2017
1:25,000 Colour Raster
March 2017
1:50,000 Colour Raster
March 2017
Points of Interest
March 2017
OS Roam:
Product Name
OS Publication Date
1:25,000 Colour Raster
March 2017
The OS data update page is kept up to date with all dataset updates in the collections.
If you have any questions about the dataset updates or Digimap please contact us:
Aerial Digimap was only launched at the end of last year but the response from the Digimap Community has been amazing. The service already has thousands of active users who have created hundreds of thousands of screen maps. Users have downloaded tens of thousands of square kilometres of this data, for use directly in reports or GIS and CAD software.
Data updates
Whilst we’re excited to see such a high level of usage of the new service, behind the scenes our Data Team are currently processing the 2015 data which will be available in the service early next month. This is the first update we have received from the data supplier, Getmapping, and contains updates to around 80,000 tiles. This is a significant update as it covers roughly 30% of the country providing more up to date imagery for a large proportion of Great Britain. The map below shows the likely distribution of the updated 2015 data.
Click on map to view larger version
Webinar resources
We recently ran a webinar highlighting the data and showcasing a number of potential uses for the imagery. The webinar was recorded in full and is available on our YouTube channel. The slides used during the webinar and a transcript of all questions and answers are available on our help page.
3D model using Aerial Imagery, OS Terrain 5 DTM and MasterMap Building Height Attribute
Data information
The aerial imagery data in the service is 25cm resolution vertical aerial imagery supplied by Getmapping PLC, and is the most detailed aerial imagery available for the whole of Great Britain. As well as being a really interesting dataset the imagery also has a number of practical uses across a wide range of disciplines from urban planning and 3D modelling to land use and archaeological studies.
Subscribing
To see if your institution already subscribes to Aerial Digimap, please see our subscribing institutions help page. Information on how to subscribe to the new service is available on the Aerial Digimap Subscription page.
If you have any questions about the service please consult the dedicated Aerial Digimap help pages or contact the Digimap support team using the details below.
Institute of Geography, University of Edinburgh by kim traynor [CC BY-SA 2.0 (http://creativecommons.org/licenses/by-sa/2.0)], via Wikimedia CommonsEDINA’s annual Geoforum conference for all its geospatial services and projects was held at the University of Edinburgh’s Institute of Geography this year. It was attended by nearly 50 delegates who came to find out what we have been up to over the past year and to see what we new things they can expect in the coming months.
The morning session started with talks from Tim Urwin, EDINA’s geo-data manager, and Guy McGarva, from the Geosupport team. Tim’s talk informed us all about the design decisions made when updating the OS MasterMap cartographic style. The new styling, originally developed for the Digimap for Schools service, has some great advantages over the old cartography and was put into service just after the conference:
Guy’s talk highlighted the main changes to EDINA’s geospatial offering in the last 12 months. We have mainly been working on things that you can’t “see” in Digimap with huge improvements to the way the service is delivered. We now can make sure that interruptions to the service are rare as it can be delivered from one of two physical locations at the University of Edinburgh.
One obvious change we delivered was the improved Digimap home page. This came about through work to make the service usable on a touch screen or tablet device. To ensure that the service could work on these devices we needed to use new web technologies meaning a redesign had to be carried out. We like the cleaner design but best of all you can now just click on the application you want to use, log in when prompted, and be taken straight to the thing you want to do. No more remembering to log in to the service before clicking the link in your Data Download email!
The next two talks were all about Aerial Imagery as EDINA will soon be launching the Aerial Digimap service. The new service will contain 25cm resolution aerial photographs for the whole of Great Britain from Getmapping.
Firstly we head from Richard Evans from Getmapping who spoke about the history of aerial imagery and also the modern technology and techniques that go in to it’s creation.
Then we heard from Ian Holmes from EDINA, who showed us what the new Digimap Aerial collection would look like. As with the other Digimap collections there will be Roam and Download interfaces to either view the data or to take it away to analyse in the user’s own software.
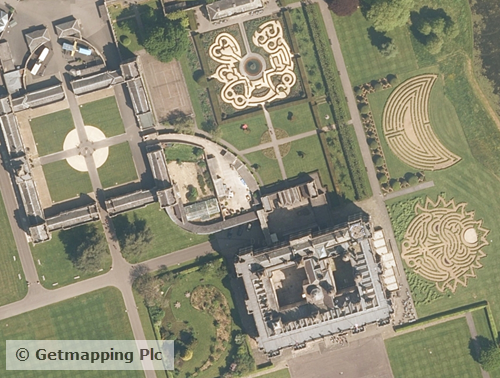
Ian also highlighted some of the interesting and quirky things captured in the images, such as the shadows of giraffes at Chester Zoo.
Please keep watching the blog and other Digimap information channels for an announcement on when the service will be launching.
After a good lunch spent networking we started on the afternoon session where we heard from two students and two members of teaching staff about their uses of Digimap and data from the services.
Firstly we heard from Trevor Draeseke who told us about his Masters Thesis, Visualising Geographical Information in Augmented Reality.
Trevor’s proof of concept mobile app the “Arthur’s Seat Augment Reality Visualiser” allowed the user to view geological data and other layered geographic information on the live video feed coming from the phones camera. He said his work was made possible by the “easy and flexible access to the underlying geographical information layers through EDINA’s Digimap Service.”
Next we heard from Kathy O’Donnell who is now in the first year of a PhD that is building on her MSc thesis on the Quarries of Hadrian’s Wall.
Kathy has been mixing layers from the various data collections in Digimap: Ordnance Survey, Historic and Geology, to identify where the Romans were quarrying the stone to build Hadrian’s Wall. Kathy’s work is one of the best examples of making use of the various collections we have seen and she is looking forward to hopefully being able to use Aerial Digimap as another important source of data.
After a short break we heard the perspective of teaching staff from the University of Stirling and Lancaster University. Firstly Phil Bartie, University of Stirling, talked about how Digimap Roam was useful for introducing students to digital mapping and and also that it was “very important that students and academics have access to high quality spatial data for teaching and research.”
The final talk of the day came from Duncan Whyatt and Gemma Davies from Lancaster University. Duncan first reminisced on life before Digimap, and how difficult it was to get hold of maps and spatial data. After subscribing they have concentrated more heavily on the data downloaded from Digimap in the Geography Department. Duncan and Gemma took us through the various exercises the students were given using data downloaded from Digimap at each stage of their degree. Duncan stated that “Digimap has underpinned Undergraduate teaching in GIS at Lancaster for 15 years…”
Despite showing how important Digimap is and has been in studying and teaching all four of the presentations contained mentions of what they’d like to see in the future and a final challenge from Duncan to stay relevant in a world with an increasing amount of alternatives. We have heard this challenge and are working with those who fund the service to make sure our offering stays up-to-date and continues to deliver what academia wants. However we would like to remind all users of Digimap to keep letting us know what you want from the service so we have enough evidence to shape future developments in the right way.
A final thank you to all those who gave a presentation, the Institute of Geography for providing a venue, and to all the attendees; we felt it was a very successful event and look forward to the next one in 2017.
If you have any questions, comments or feedback on this post then let us know:

![kim traynor [CC BY-SA 2.0 (http://creativecommons.org/licenses/by-sa/2.0)], via Wikimedia Commons](https://blogs.ed.ac.uk/digimap/wp-content/uploads/sites/6760/2016/08/University_building_Drummond_Street_-_geograph.org_.uk_-_1352882-1.jpg)