Any views expressed within media held on this service are those of the contributors, should not be taken as approved or endorsed by the University, and do not necessarily reflect the views of the University in respect of any particular issue.
Digimap is an online map and data delivery service, available by subscription to UK Higher and Further Education establishments. Operated by EDINA at the University of Edinburgh, Digimap offers a number of data collections, including Ordnance Survey, historical, geological, aerial photography, LiDAR, marine maps, land cover mapping, global mapping and census data. For more information about Digimap go to our website: https://digimap.edina.ac.uk Background image Contains OS data (c) Crown Copyright and database right 2022
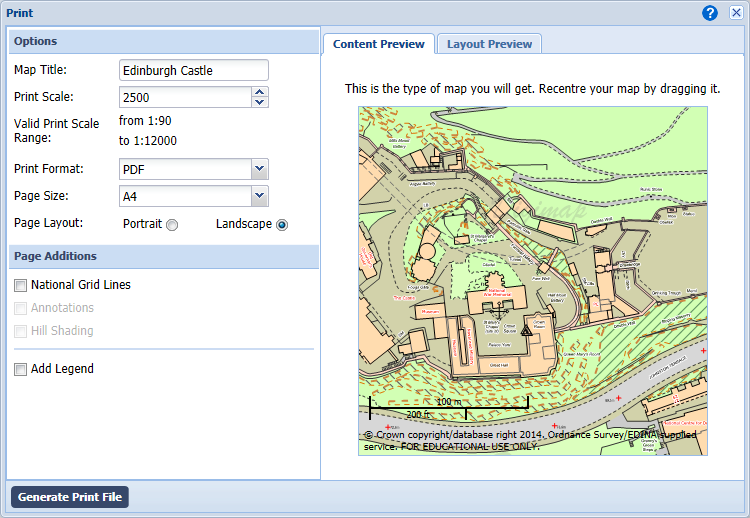
You can now print a legend with your map in Digimap Roam, Geology Roam, Marine Roam and Environment Roam. The legend comes as a separate A4 PDF to your print map and is placed in a zip folder with the map for you to download.
When printing maps that have been customised by removing certain layers, those layers will not appear in the legend ensuring it is as concise and easy to use as possible. Geology Roam goes a step further as its legend filters out any entries for features that are not actually on the map you print.
Legends are particularly important for both the Geology and Environment Roams where abstract colours are used to denote the underlying rocks or land cover. When using the maps online you can use the map content tab or the map information tool to find out what features you are looking at. Now, with the addition of the printable legends, you can reference what these colours represent on the maps printed from the service too.
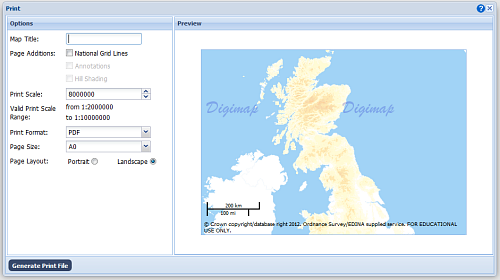
To add a legend to your print map simply check the box in the interface, as shown above.
In addition to the legend we have also added a Layout Preview tab to the print interface in all the Roams, including Ancient Roam. This tab allows you to see the full extent of the area you are about to print, very important if you change the scale or paper size. Any changes that will affect the area printed will trigger the tab to flash yellow, indicating that you will now get a different map. Even adding the grid to the map will slightly change the area printed as it requires a wider margin.
Once you have clicked on the tab you will see the precise area of map to be printed highlighted in orange. You can click and drag the map in this window around, refining the exact location to be printed. As you make changes to the paper size and scale you will see how these also change the area that will be printed.
The addition of this tab will make it much easier to get the right area printed the first time when used in conjunction with the content preview. Remember that the layout preview only shows the area you are printing over a backdrop map for guidance; to see the actual map information that will be printed you need to look at the content preview.
Once you are happy that you have the right map content for the right area click on the Generate Print File button, you will then be able to download the zip folder with your map and legend.
If you have any questions about these changes then please let us know:
EDINA have added data for Northern Ireland to Environment Digimap after an agreement between Jisc and the Centre for Ecology and Hydrology (CEH) to extend the service beyond Great Britain.
The data comprises of 25m and 1km resolution raster datasets for 2000 and 2007 as well as vector data for both these years. The data shown on the right is the 1KM resolution raster data from 2007.
The datasets essentially classify the land into categories including: sea and inland waters, bare, suburban and urban areas, arable farmland, pastures and meadows, rough grass, grass heaths and moors, bracken, dwarf shrub heaths and moorland, scrub, deciduous and evergreen woodland and upland and lowland bogs. These maps can be used to plan, manage or monitor agriculture, ecology, conservation, forestry, environmental assessment, water supplies, urban spread, transport, telecommunications, recreation and mineral extraction.
The Northern Ireland data is currently available from Environment Download only but will be available in Environment Roam once we have created backdrop mapping and search infrastructure for Northern Ireland.
For details about Environment Digimap and how you can subscribe please see this earlier blog post:
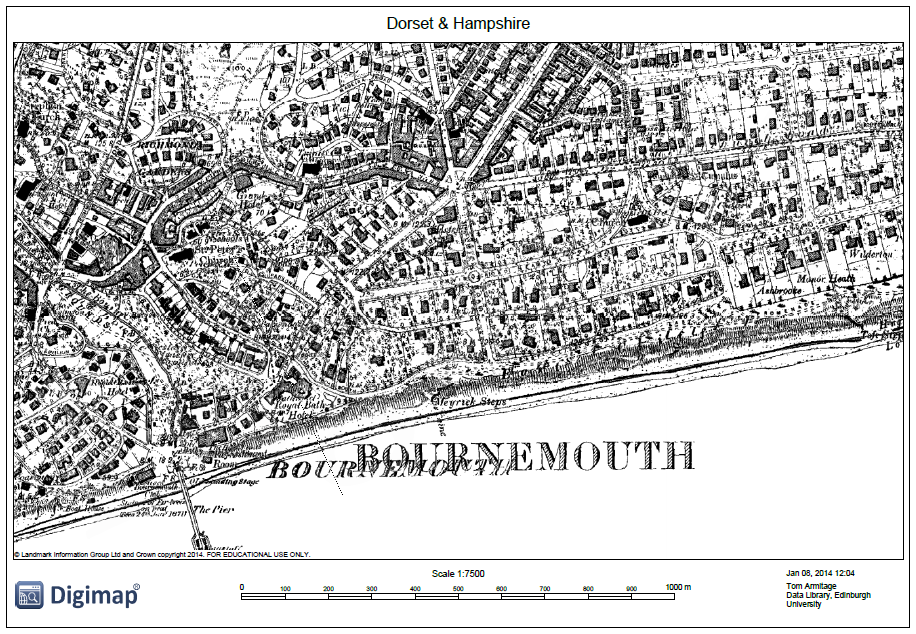
Ancient Roam in Historic Digimap has had its print options updated so it now has the same set of options as the other Roam facilities. The two big changes to note are that you can now print up to A0 and that you can print a single county in areas where several overlap.
Until this change was made it was impossible to print an area with overlapping maps without printing all the counties available rather than just the one(s) you were viewing on the screen. Any print files now generated in areas with overlapping counties will only show those which are displayed on screen. This allows you to have the control over how much information is on your map and to make the decision to show more or less information.
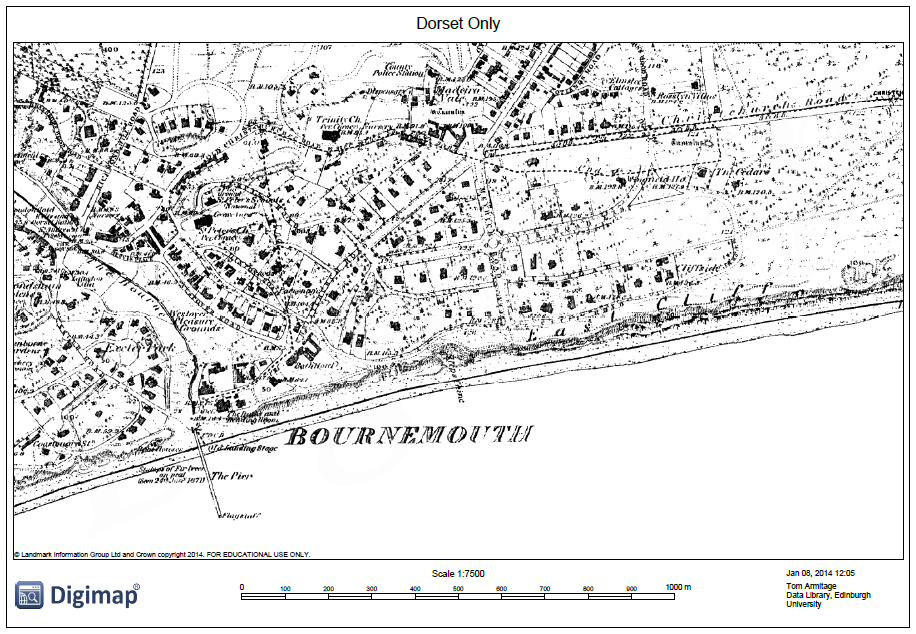
Sometimes it can be an advantage to show multiple counties as even though the sheets overlap the actual map information doesn’t. However in the example above you can see how the counties overwrite each other in the map on the left and so produce a very confusing and fairly useless result; by switching one county off you can produce a much clearer print map such as the one on the right. [Click on the images above to view larger versions of the maps.]
The ability to print maps up to A0 brings Ancient Roam into line with the other Roam facilities so you can now print at this very large size in any Digimap collection.
EDINA has updated the most detailed maps in Geology Digimap to the latest version from the British Geological Survey (BGS). The 1:50,000 scale maps and data in Geology Roam and Geology Download are now the DiGMapGB-50 Version 7 data from the BGS.
The main differences between this data and the previous versions is that there is an extra tile of data in Wales, EW150 Dinas Mawddwy, and that the linear features are now contained in a single shapefile rather than being in several separate layers. The 7 different linear feature layers; Alteration, Fault, Fold Axis, Fossil Horizon, Landform, Mineral Vein, and Rock are now all combined in a single Linear layer.
The following tiles have all undergone major changes:
Scotland
SC008E_Loch Doon (Superficial)
SC016E_Ettrick (Bedrock)
SC073W_Invermoriston (Superficial)
SC084E_Nairn (Bedrock)
SC092E_Loch Fannich (Bedrock)
SC101E_Ullapool (Superficial)
SC102W_Oykel Bridge (Bedrock)
SC108W_Ben Hee (Bedrock)
England & Wales
EW039 Kendal (Superficial)
EW075 Preston
EW085 Manchester
EW086 Glossop
EW100 Sheffield
EW112 Chesterfield
EW150 Dinas Mawddwy
EW167 Dudley
EW174 Thetford
EW203 Bedford
EW224 242 Colchester Brightlingsea
EW247 Swansea
EW265 Bath
EW283 Andover
EW310 Tiverton
EW346 Newquay
For more details about the 1:50,000 and other DiGMapGB datasets you can download the Information Notes directly from the BGS: DiGMapGB Information Notes
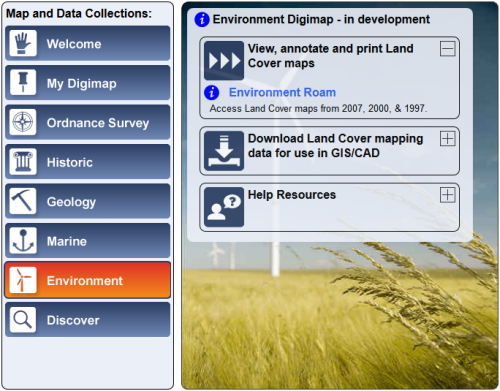
EDINA and Jisc are pleased to announce the launch of a new Digimap Collection, Environment Digimap.
This new collection offers land cover map data from the Centre for Ecology & Hydrology (CEH). Environment Digimap is a subscription service; however, it will be available free of charge until 31 July 2014. After this period a subscription fee will apply per institution.
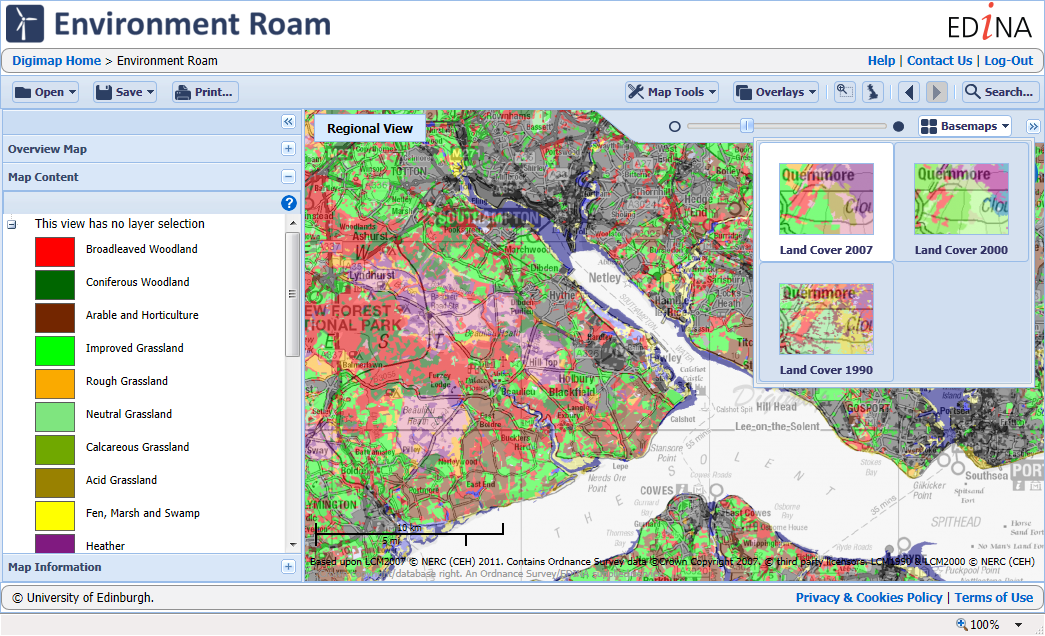
Environment Digimap offers two facilities: mapping through Environment Roam, and the ability to download data through Environment Download. The data available, CEH’s Land Cover Map products, provide a snapshot of land cover for each of the years 1990, 2000 and 2007. There are raster datasets available at 25m and 1km resolutions for each year and a vector version of the 2000 dataset. The data are in a range of formats depending on the year. More details are available in the Environment Digimap Help Pages: CEH Products Available
How to get access…
To use this service for free your institution needs to subscribe, this is free till the end of the 2013 – 14 academic year and can be arranged via the Jisc Collections website:
If your institution doesn’t subscribe the Environment Digimap button on the home page will be grey. Contact your Digimap site rep and they will be able to help arrange your institutions subscription: List of Digimap Site Reps
If you have any questions about Environment Digimap, please contact us:
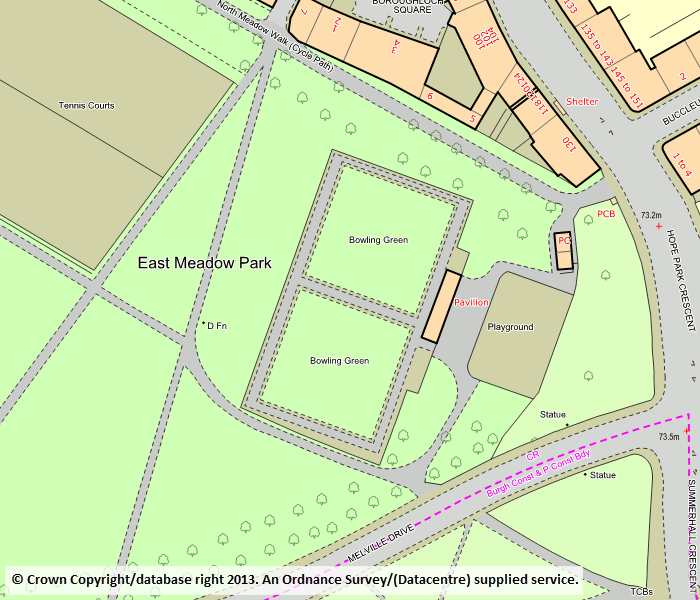
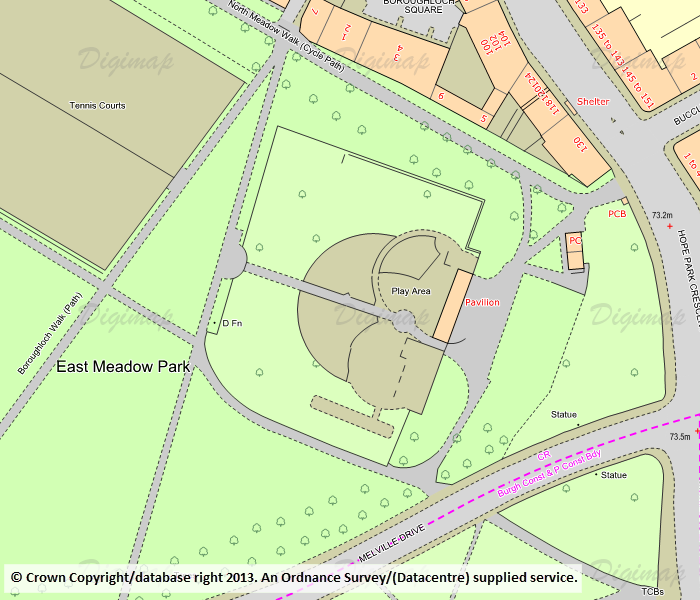
We have updated three of the mapping datasets in Digimap Roam, so you can now view mapping published as recently as June 2013.
The products updated are:
OS MasterMap: used in the three most detailed zoom levels in Roam.
OS VectorMap Local (VML): the next most detailed maps in Roam, available as alternate “Basemaps” in the 4th and 5th most detailed zoom levels.
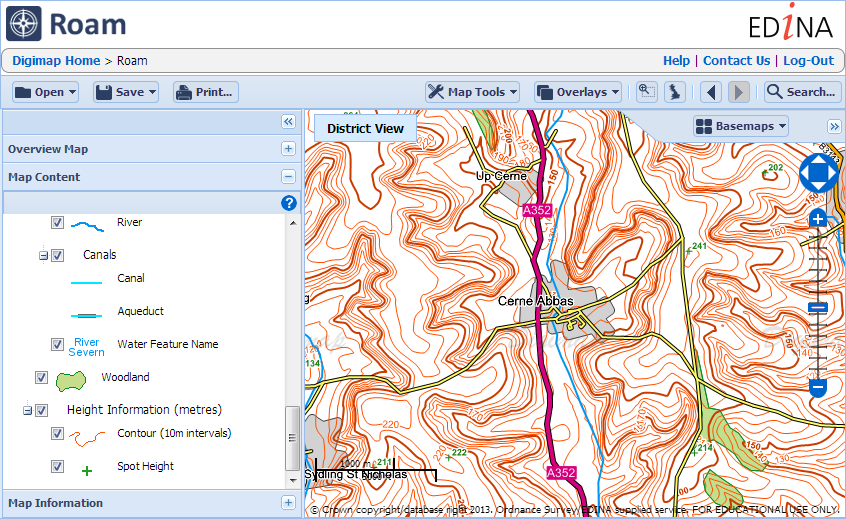
Midscale Maps: These maps are made of the Meridian 2 mapping data along with contours. Until now they had been made with Land-form PANORAMA data, but now they use the new OS Terrain 50 contours:
These midscale maps are also available in a backdrop colour scheme which can be accessed by using the Basemaps tab at the top right of the map. The faded colours allow your annotations to show more strongly:
The updated datasets are also available from Digimap’s Data Download service (except MasterMap which will follow in the next few months), a page in Digimap Help details the all the OS products available and their currency in Roam and Data Download:
All the Digimap Roam interfaces are due to change this August, with the provisional date set to Tuesday the 13th. There are three specific changes that all existing users of any of the Roam interfaces need to know:
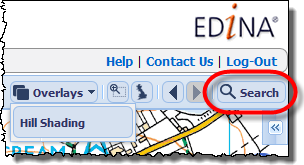
To search for your chosen location you now click on the Search button found above the map on the right-hand side.
Once you have clicked the Search button a new window will open allowing you to do a simple search for a place name or postcode, or a more advanced search using coordinates on either the British National Grid as a grid reference or Eastings and Northings, or as Latitude and Longitude values.
Print Changes
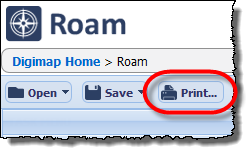
To make a PDF, PNG or JPG print file of your map you now click on the Print button which can be found above the map on the left-hand side.
Once you have clicked the Print button a new window will open allowing you to change the print options such as paper size, orientation and scale.
Once you are happy with the settings click Generate Print File, you will be asked to save the file created in the usual way for your browser.
Opening and Saving Maps and Annotations
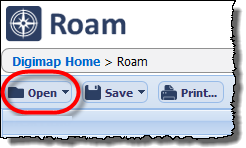
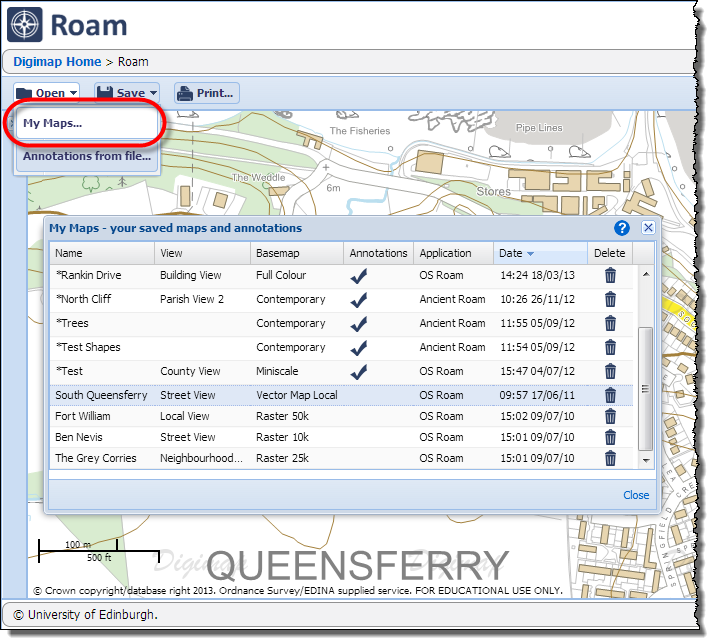
Don’t panic! All your saved maps and annotations from the previous version of Roam will all still be available. To open existing maps or annotations click on the Open button and then My Maps… Once you have clicked on the button a new window will open that allows you to access all the maps and annotations you have saved in any of the Roam interfaces. Annotations are now saved as part of your Map!
In this window you can choose your map and also delete ones you no longer need. If you made a map in a different Roam, opening it will take you to the location and the equivalent zoom level. If it had Annotations, these will be drawn on the new map.
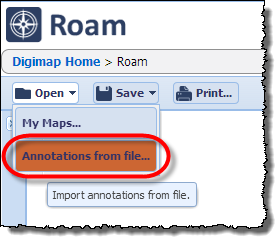
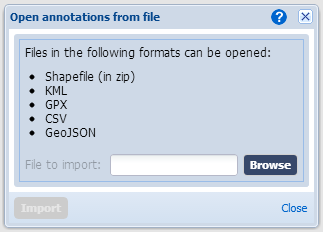
The Open button also allows you to import annotations from a file saved on your computer. Click on the Annotations from file… option to open a window where you can specify the file you want to upload.
When using the service you can click on the blue question mark icon for help on how to use this feature.
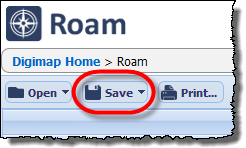
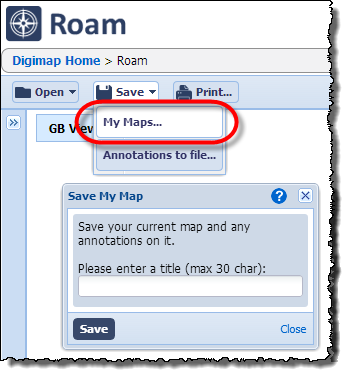
When it comes to saving your maps and annotations you now just click on the Save button and again pick the My Maps… option. This will open the Save My Map window where you save both the map and any annotations that are on it.
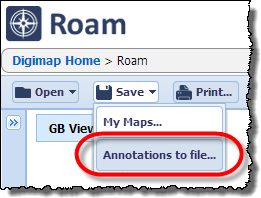
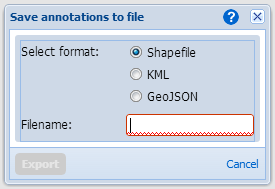
In a similar way to importing annotations, to Export them to a file you click the Save button and then choose the Annotations to file… In the window that opens select the format of the file you want to save and give it a name; clicking Export will then download the file to your web browser’s usual location.
Other Changes
There are several other changes to the interface that make it easier to use some features of Roam that you may have missed in the past, see this previous blog post for more information:
As part of ongoing efforts to improve the usability of data delivered by Digimap, we have made some significant enhancements to one of the Ordnance Survey licensed datasets.
OS VectorMap® Local is a relatively new product from Ordnance Survey providing slightly less detail than OS MasterMap but still very useful for detailed backdrop mapping. Individual buildings are shown as well as roads, rivers, landcover and contours. The vector version of the data is provided by Ordnance Survey in GML 2.1.2. This is a standard geospatial data format developed by the Open Geospatial Consortium; however it generally needs to be converted into a proprietary format before being used in GIS and CAD software.
To make using this data easier we are now providing OS VectorMap Local in both Shapefile and DWG formats. Shapefiles can be easily opened in ArcGIS and most other GIS programs including OpenSource GIS software such as QGIS and gvSIG. DWG is the native format for AutoCAD and can be used in many other CAD systems as well.
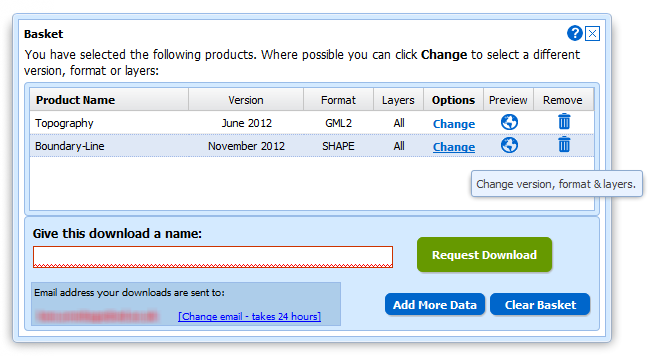
This data is now available for download from the Data Download application in the Digimap Ordnance Survey Collection. VectorMap Local is in the Vector Data section; to change the format of the data you are downloading click on the Change link under Options once you have added it to the basket.
Click image to view full size.
Creating the data:
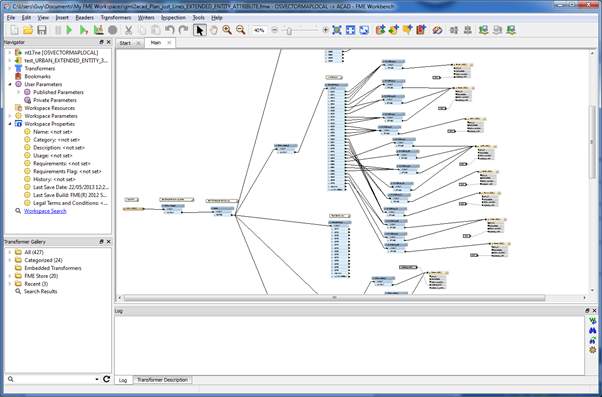
TO achieve the best results when recreating the data in different formats we had to use different software products for different formats. To convert the data to Shapefile we used the OpenSource Software GDAL program called “ogr2ogr” and for the DWG conversion we used FME from Safe Software. The image below shows part of the FME Workbench project used to convert the data to DWG.
Click image to view full size.
1: Shapefiles
To convert the GML to Shapefile we created a lookup table between the Feature Codes in the GML data to Shapefile Layers. As Ordnance Survey do not provide any guidance in their User Guide as to how to group features in VML , we analysed the data and experimented with various groupings, so that in the end we split the data into a possible 22 separate Layers. These layers may contain multiple feature classes but as they all have the original feature codes on them as attributes as well as all the other original attribution, further distinction between features can be achieved for representation and querying.
Example of the Shapefile data in ArcMap:
Click image to view full size.
A simple set of Layer Files has been created for use in ArcMap and can be downloaded from the VML Help page.
2. DWG
To convert the data to DWG we had to go through a similar process (as well as our data team becoming much more familiar with AutoCAD). We originally intended to produce DXF format data but this turned out to be a problem. We had to make some decisions about how to store attribution in the output data and one of the main considerations was the size of the resultant files. To begin with when we converted a tile of VML that was 60Mb of GML, it expanded in size to 240Mb when converted to DXF containing attributes as Inserts. This was unusable in systems we tried so we had to work on ways of making the files smaller. The first thing we did was change the format from DXF to DWG. As both formats are commonly read by various CAD systems this seems a reasonable thing to do although it may make the data slightly less interoperable. This changed the file size to 44Mb for our sample dataset. This was still quite large and some systems were having problems with this, especially when dealing with tiles in dense urban areas. We therefore decided to change the way we were storing attributes in the data. Instead of using Inserts we used Extended Entity Data (or XData) which was one of the options available in FME. This stores a fixed amount of information against an entity in the drawing. We use this to store the attribute information that was in the original GML data, including the original feature code. It’s a bit more difficult to work with this data but it can be viewed in AutoCAD Map 3D by using the Express Tools –> Tools –> List Object Xdata or typing xdlist in the command prompt.
Using XData brought the size of our sample tile down to 10Mb and was usable in all the systems we tested it with. If you need access to the attributes either as Inserts or as Map 3D Object data please let us know.
As part of the conversion process we defined the representation for features in the DWG file, including point symbols and area fills. Features have also been grouped together into separate Layers as we did with the Shapefiles.
Example of the data in AutoCAD:
Click image to view full size.
Finally, after getting the project set up in FME and a thorough testing of the data, we ran the batch process to convert the data. This took nearly 3 days per format to convert the full load of our national coverage of VML data. This data will be updated on the normal update schedule, as we get updated VML from Ordnance Survey as Change Only Updates so future conversions will be much quicker.
Remember,both these datasets are available through Data Download by selecting VectorMap Local and then changing the format after you have added the data to your basket.
We intend to produce alternative formats for other products, including OS MasterMap, so we would very much like to hear your thoughts on the data that we have produced so far and let us know if this meets your needs.
The Digimap Roam interfaces will receive some important updates over the summer break. The changes will make Roam’s functionality consistent for all collections and allow new functionality to be more easily added. These changes will also improve usability, making some previously hard to find options much more visible.
The main changes being made are as follows:
All the roams will use the same colour scheme and styling along with consistent buttons and terminology
The Search function will have a new interface
The Print function will have a new interface
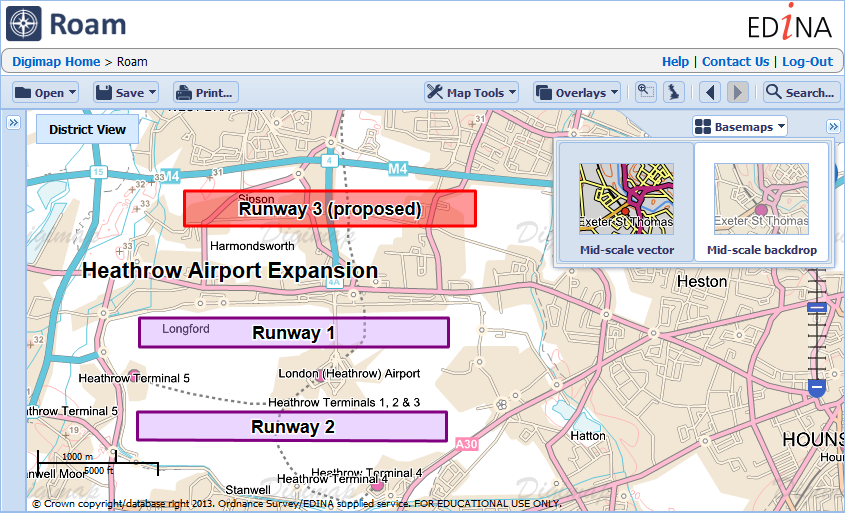
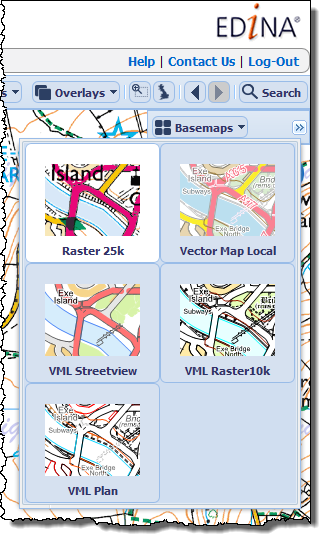
Users can change the map style using the new Basemaps button
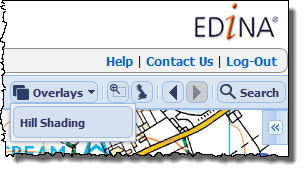
Users can add extra data using the new Overlays button
Opening and Saving maps and annotations will be done through buttons in the top menubar
Please note that the images below show the current state of the interfaces; they are still in development and so are subject to change.
1. All the Roams will use a common interface design, however there will be some features that are unique to each one, such as the time-line in Ancient Roam, but generally each one will look very similar and work in the same way.
2. The new Search interface will appear when you click a button in the top menu rather than in the sidebar to the left of the map. Although there may not be many differences to begin with, this change will allow us to add in more ways to search for your location in the future.
3. Initially the new Print interface will be very similar to the current one in Digimap Roam, though it will now appear in a new interface when you click a button in the top menu. The main advantage with initial changes will be that print sizes up to A0 will come to all collections (except Historic) as well as user defined print scales. We are planning more extensive changes to the Print interface in the near future.
4. Users can currently alter the style of the map by changing the Map Theme in the legend. This functionality is quite hard to find so in the new Roams we are adding a Basemaps button to do this. Where available, users can select from a list of alternative styles, such as MasterMap in the old LandLine style. In addition to the existing extra Vectormap Local and MasterMap styles there will be new styles for Vectormap District, Meridian and Strategi datasets coming soon.
5. We are adding an Overlays button so that users can add additional data layers on to the map. Initially this will be the hill shading already provided in Roam, however we hope to add Postcode Boundaries and Contour lines soon. This functionality used to be available in Carto several years ago but was lost when we moved to a new GIS platform, it is now making a welcome return.
6. Finally, we are introducing Open and Save buttons as ways of saving your maps and annotations and then opening them again. These buttons replace the My Maps section on the left side of the map and the Save, Open and Export buttons in the Annotations Tool bar. The aim is to make it much easier to see what you are saving and opening. It will also make it more obvious that you can open annotations you have created in one Roam interface in any of the others you have access to.
If you have any questions about the new interface or anything else then please let us know:

 You can now print a legend with your map in Digimap Roam, Geology Roam, Marine Roam and Environment Roam. The legend comes as a separate A4 PDF to your print map and is placed in a zip folder with the map for you to download.
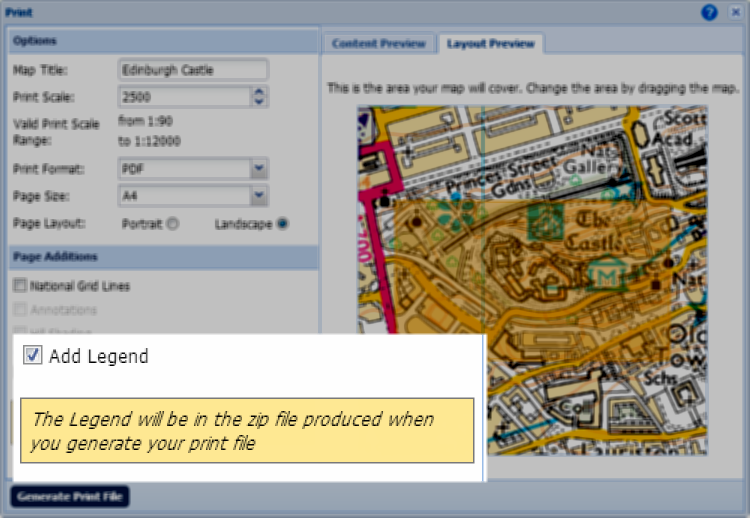 Legends are particularly important for both the Geology and Environment Roams where abstract colours are used to denote the underlying rocks or land cover. When using the maps online you can use the map content tab or the map information tool to find out what features you are looking at. Now, with the addition of the printable legends, you can reference what these colours represent on the maps printed from the service too.
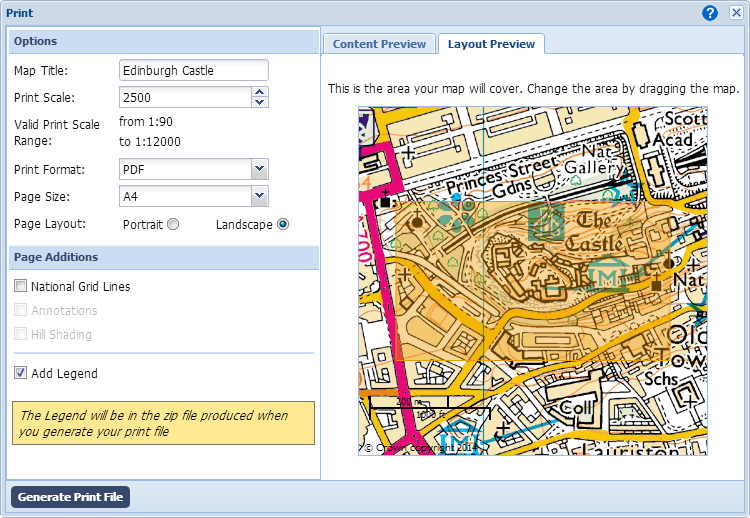 Once you have clicked on the tab you will see the precise area of map to be printed highlighted in orange. You can click and drag the map in this window around, refining the exact location to be printed. As you make changes to the paper size and scale you will see how these also change the area that will be printed.