We are very pleased to announce that we we recently added WMS (Web Map Service) functionality to all Digimap Roam applications. This new facility allows you to pull in map data from a whole host of publicly accessible services allowing you to visualise a wealth of data in the familiar Digimap Roam interface. This is beta functionality, and there are a few areas that need further improvement but we were keen to get it out there as quickly as possible so that you could start making use of it. Whilst we continue to work on the functionality, we welcome any feedback you may have. Our contact details can be found at the bottom of this post.
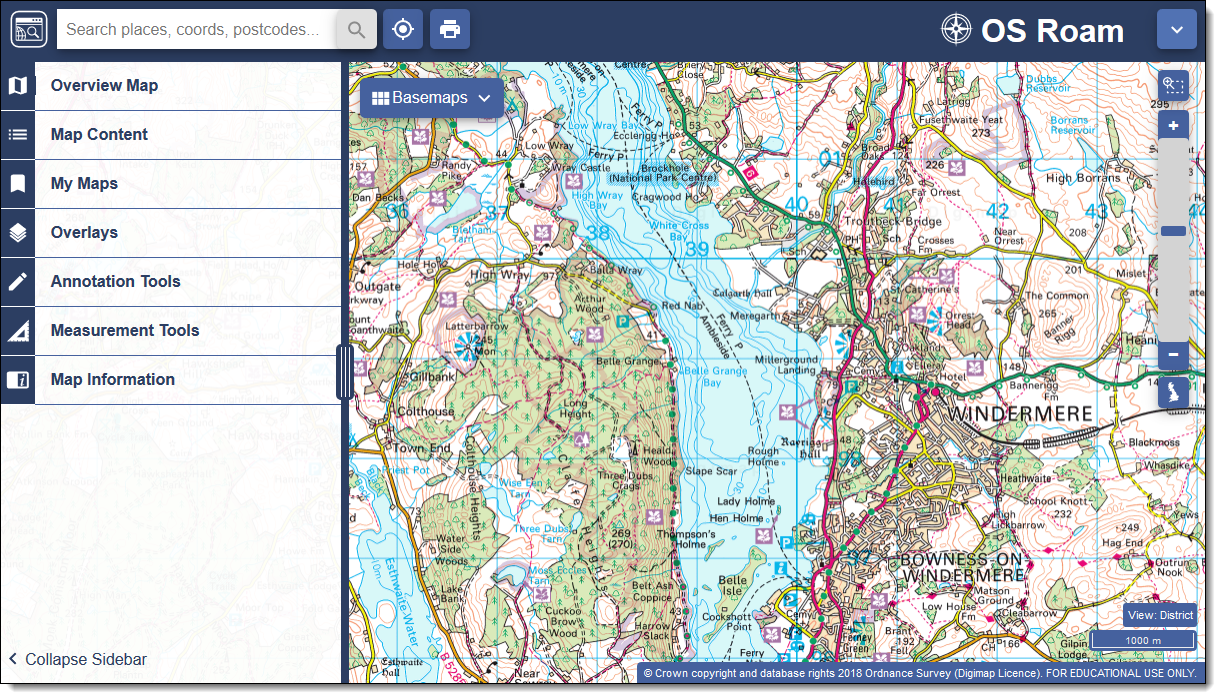
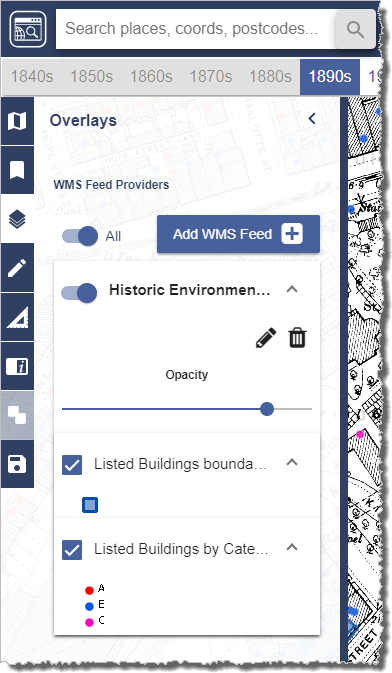
The WMS functionality can be found in the Overlays menu panel on the left hand side:
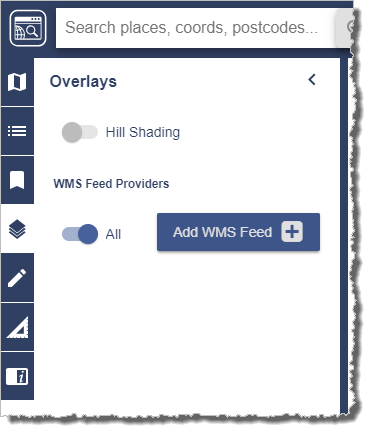
To add a WMS feed to your map you need to press the Add WMS Feed button, which will bring up the following window:
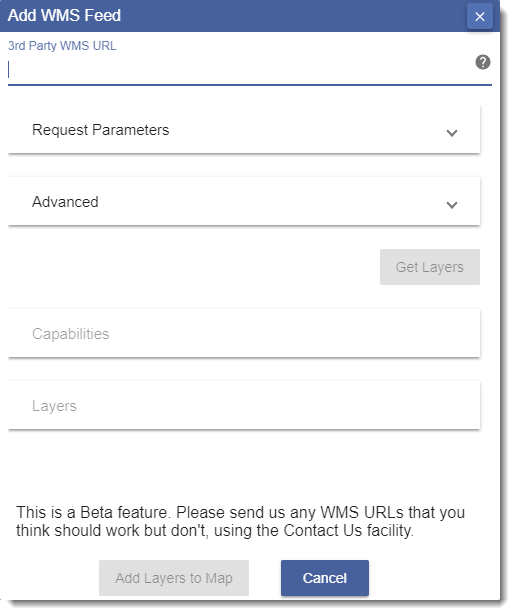
You will need to paste the getCapabilities URL in to the ‘3rd Party WMS URL’ field at the top of the popup. This URL is usually in the following format, but may be different depending on the service:
https://[servername]/service?SERVICE=WMS&Version=1.1.1&REQUEST=getCapabilities
Having entered the URL the Get Layers button should become active, press this to retrieve all the layers available via the entered WMS URL. Finally add the layers to your map using the Add Layers to Map button to add them to your current map window. You can then control the opacity of each layer using the appropriate opacity slider and the order they are displayed by clicking and dragging. It’s possible to edit the names displayed e.g. to choose shorter names that are easier to see by pressing the edit button next to each entry:
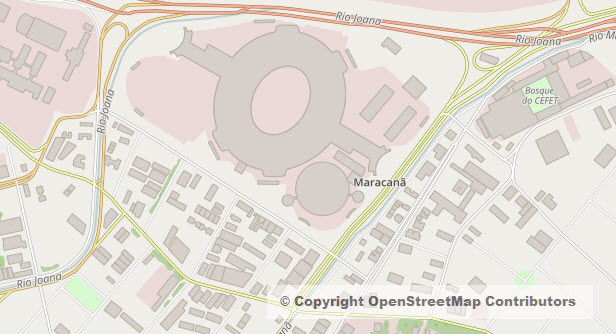
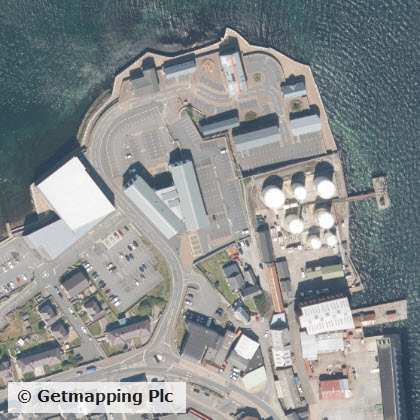
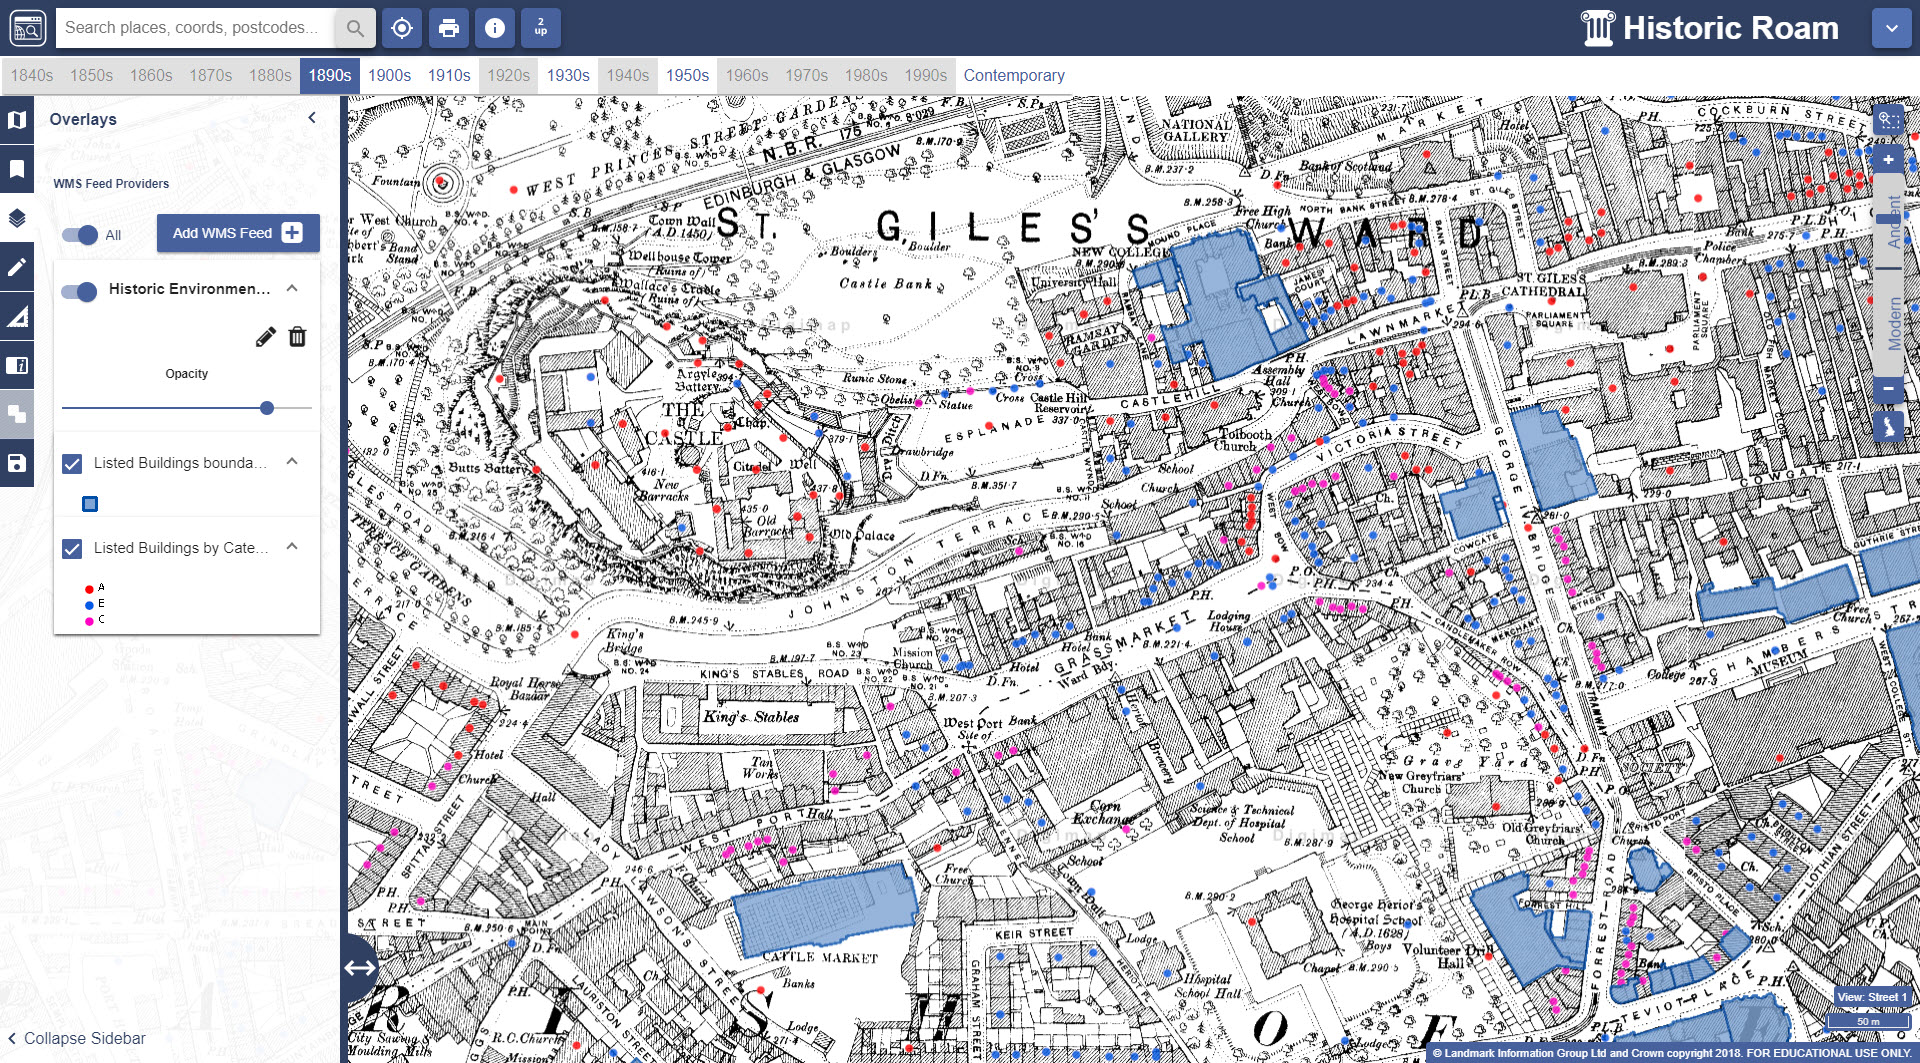
There are numerous WMS available for the UK, many of which are listed on data.gov.uk. The image below shows listed buildings (boundaries and category) published by Historic Environment Scotland on top of the 1st Edition 1:2500 County Series map published in 1896 in Ancient Roam:
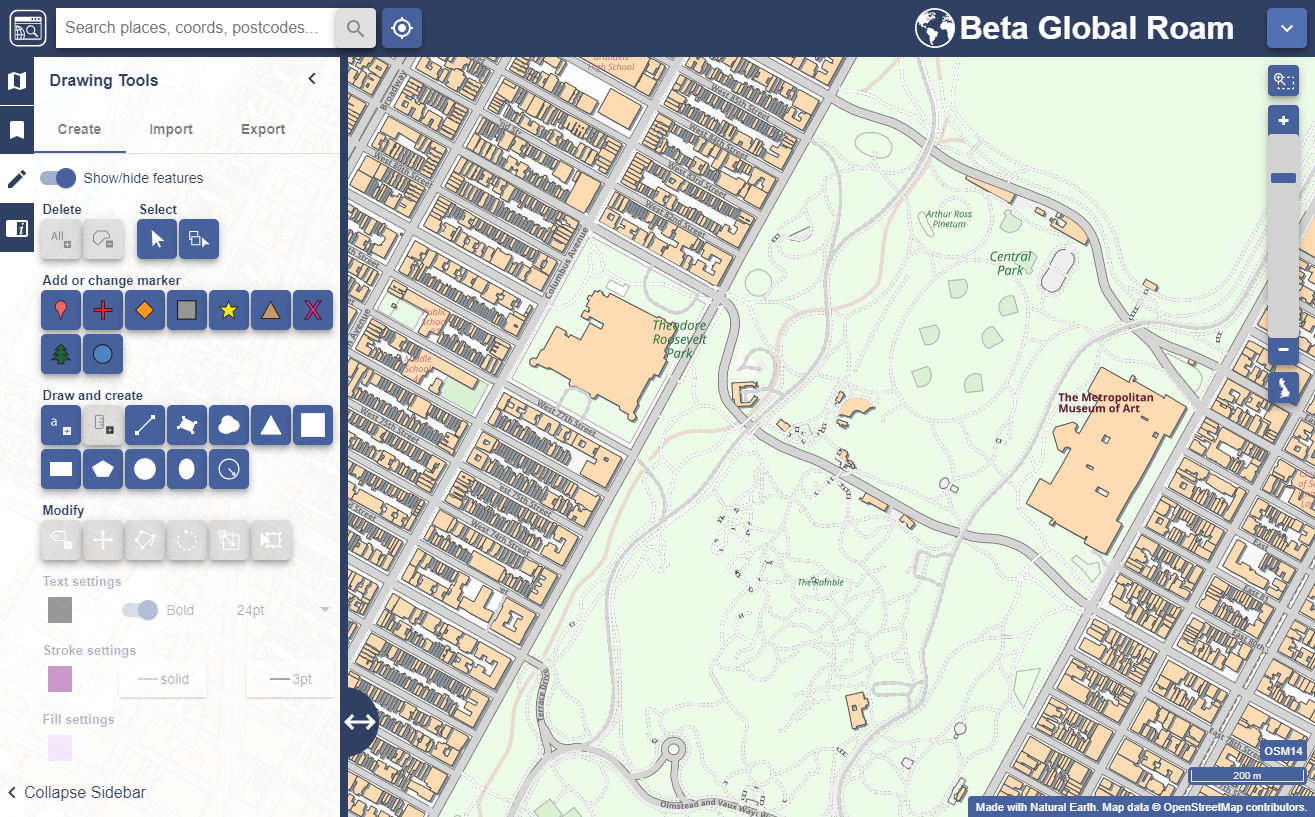
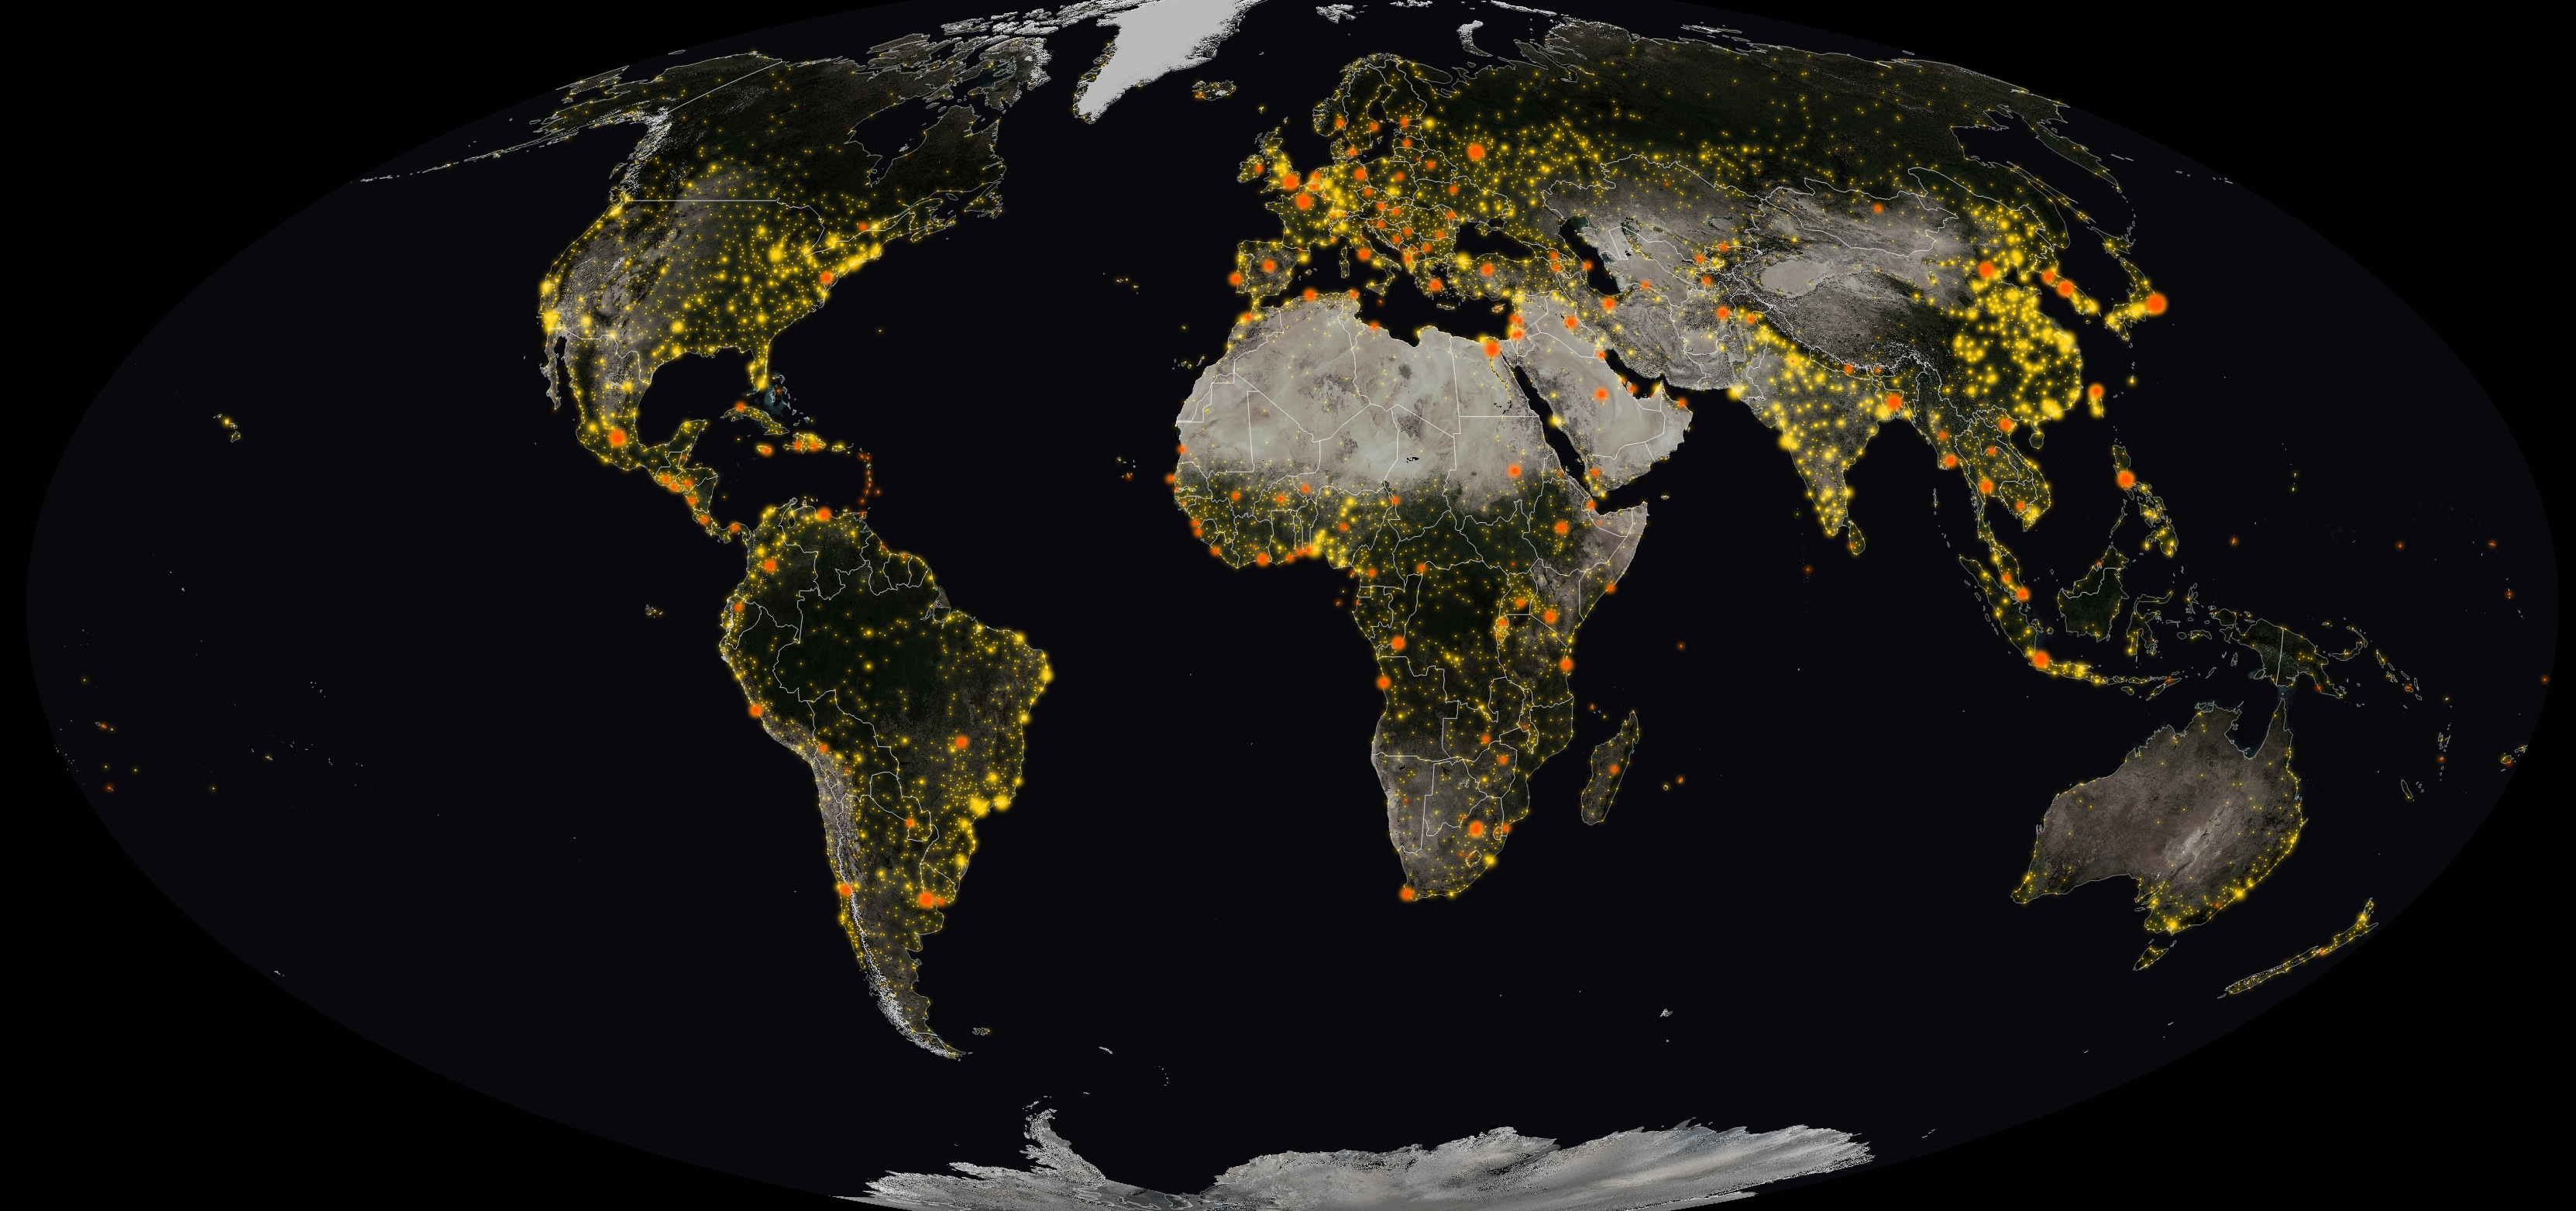
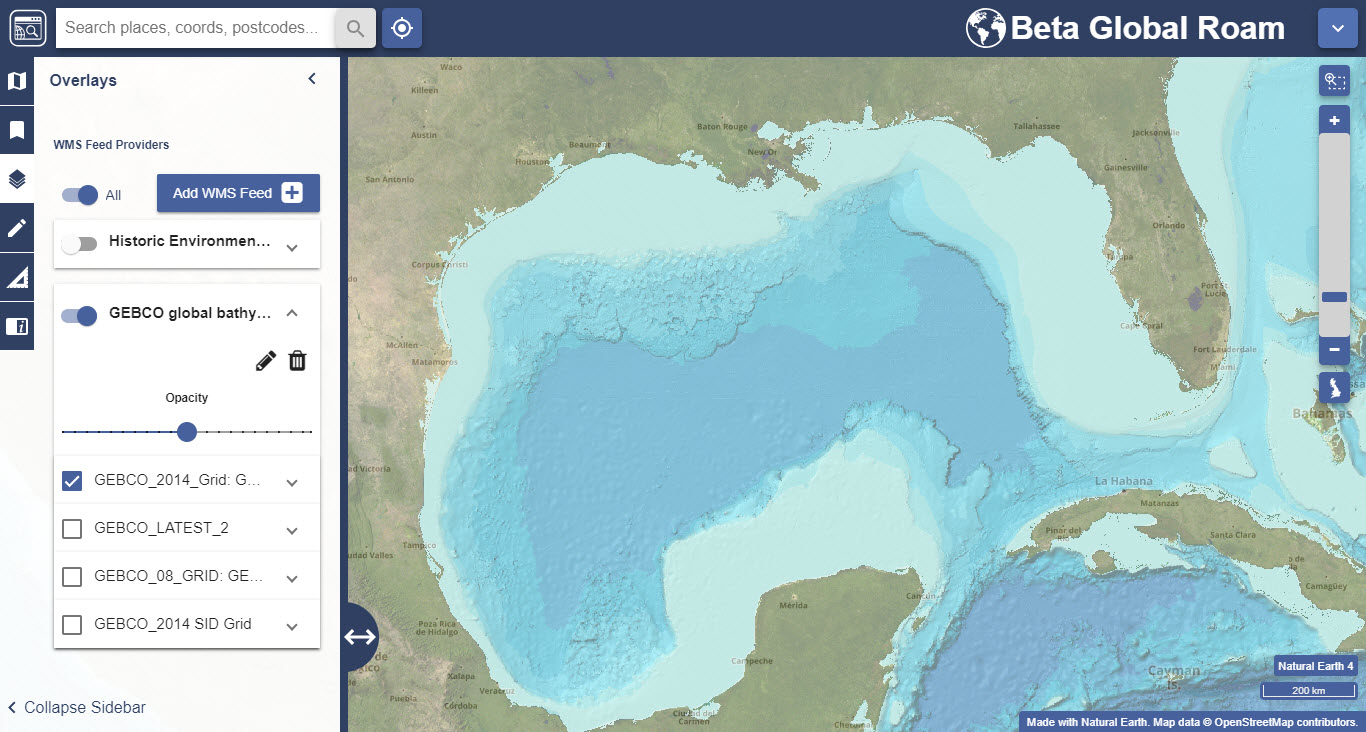
There are also lots of WMS available that serve up global data and can be viewed using the latest Global Digimap collection. One example of this is the General Bathymetric Chart of the Oceans (GEBCO), shown below in Global Roam centred on the Gulf of Mexico:
We have put together a help page which lists examples of a variety of WMS from different sources. Whilst we can’t guarantee that they will all work all of the time if you do come across a WMS that you think should work and have tested that it works in other software, such as QGIS or ArcGIS Online, please let us know so we can improve the service.
Known issues
As mentioned above, this is new beta functionality and as such there are a number of known issues and things to bear in mind:
- Currently no warning messages are displayed if a WMS fails to load. If the data has not appeared after a reasonable period of time please try to access the data via the same URL in QGIS or ArcGIS Online. If the data does load in QGIS or ArcGIS Online please send the URL to us so we can investigate.
- In some cases the Get Layers button will not return any layers. When this happens it is worth copying and pasting the text displayed if you visit the getCapabilities URL in a browser window in to the Advanced box.
- WMS data is not included in print files.
- It is not currently possible to edit the details of a WMS service or dataset names in IE11 as the wrapping in the edit window is not quite correct.
- Some WMS URLs (including those published by the Environment Agency) are published with the HTTP prefix but in order for these to work in Digimap Roam you need to change the prefix to HTTPS instead.
- The WMS must be able to supply data in the same projection of the current Roam application. All Roam applications use the British National Grid with the exception of Chart Roam and Global Roam which both use WGS84 Web Mercator. No warning is given if the WMS projection is not compatible with the current Roam application.
- WMS entries in the Overlays panel are persistent between log-ins in the same browser, so if you add a WMS in Chrome, the same WMS entries will be available the following day in Chrome providing the browser cache/temporary storage has not been cleared overnight.
- WMS entries added in one Roam application are also automatically available in all other Roam applications e.g. if you add a WMS in OS Roam it will also be available in Historic Roam etc.
- There is no Get Feature information displayed for a WMS layer so you cannot click on a feature and get its attribute information. However the Legend for the layer is displayed in the WMS panel if you expand the layer.
Get in touch
If you have any questions or comments about the new functionality please do not hesitate to get in touch; our contact details are below:
- Email: edina@ed.ac.uk
- Phone: 0131 650 3302