Student projects
Undergraduate material
Met1: Meteorology: weather and climate – Large Scale weather Systems
- Two lectures on tropical cyclones
Undergraduate projects
1. Example project from final year Geophysics and Meteorology
WIND FARMS: THE CONSISTENCY OF SUPPLY ISSUE by NICHOLAS JOHNSON
Abstract
WIND FARMS: Full report
2 & 3. Examples of projects and posters from final year Meteorology
ATMOSPHERIC POLLUTANTS IN AND AROUND MANCHESTER, UNITED KINGDOM by
CHRISTINA ROBERTSON
Example project – Atmospheric pollutants
COLD-WAKE PRODUCTION BEHIND TROPICAL STORMS IN THE WESTERN NORTH PACIFIC by JULIA PEREZ
Example poster – Cold wakes behind hurricane tracks
4. Example project from final year Geophysics
ATMOSPHERIC CIRCULATION AND OZONE IN RURAL SCOTLAND
Atmospheric Ozone
Of all the ozone (O3) present within the atmosphere, around 90% exists within the stratosphere. This is the region which extends from around 10km to 50km above the surface of the Earth. At these high altitudes, ozone absorbs the ultra violet radiation from the Sun, and in turn protects the health of living beings on the planet’s surface. The remaining ozone occurs within the troposphere. Throughout the UK, Europe and North America, ozone is a major gaseous pollutant. High concentrations present a health and environmental threat; the highest concentrations tend to occur rural rather than in urban areas.
Sources and Variations of Ozone with Space and Time
Ozone is produced in the stratosphere when solar radiation (UV radiation) hits oxygen molecules (O2) and oxygen atoms (O), causing them to combine to form ozone molecules (O3). In the troposphere, surface ozone has two sources: downward transportation from the stratosphere, accounting for around 20 – 40% of the ozone, and the photochemical production from chemical precursors, accounting for around 60 – 80%. The influx from the stratosphere reaches a peak level during the late- winter and early-spring. The ozone present in the troposphere due to this process is known as the background ozone. An additional tropospheric source is photochemical ozone. Half of the pre-cursors responsible for the production of photochemical ozone are due to human activities; the rest are a result of biogenic activities. Photochemical ozone is generated in the presence of sunlight by complex reactions between oxygen (O2), nitrous oxides (NOx) and volatile organic compounds (VOCs). During the day, ozone formation occurs. However, during the night, when solar radiation and temperatures are low ozone is destroyed. Similar sequences of reactions occur on an annual basis, with chemical destruction of ozone reaching a peak in winter and a minimum in summer due to variations in sunlight and UV radiation between the seasons. As a result ozone concentrations tend to be higher in June, July and August in the northern hemisphere. In urban areas, where nitrous oxides and VOCs reach high levels (due to greater volumes of traffic and greater levels of fossil-fuel combustion) ozone intensities are found to be low in comparison to rural sites. The nitrous oxides are oxidised by ozone gas, which causes a reduction in ozone levels. Rural areas, which have a lot less traffic and industrial activity, tend to have higher concentrations of ozone (i.e., less nitrous oxides are present to deplete the ozone concentrations). The Figure below shows how the greatest contrast in ozone levels over continental Europe is between winter and summer. The main difference between these two seasons is that in winter there is an ozone high over the ocean and an ozone low over the continent, whereas in the summer the situation is reversed.
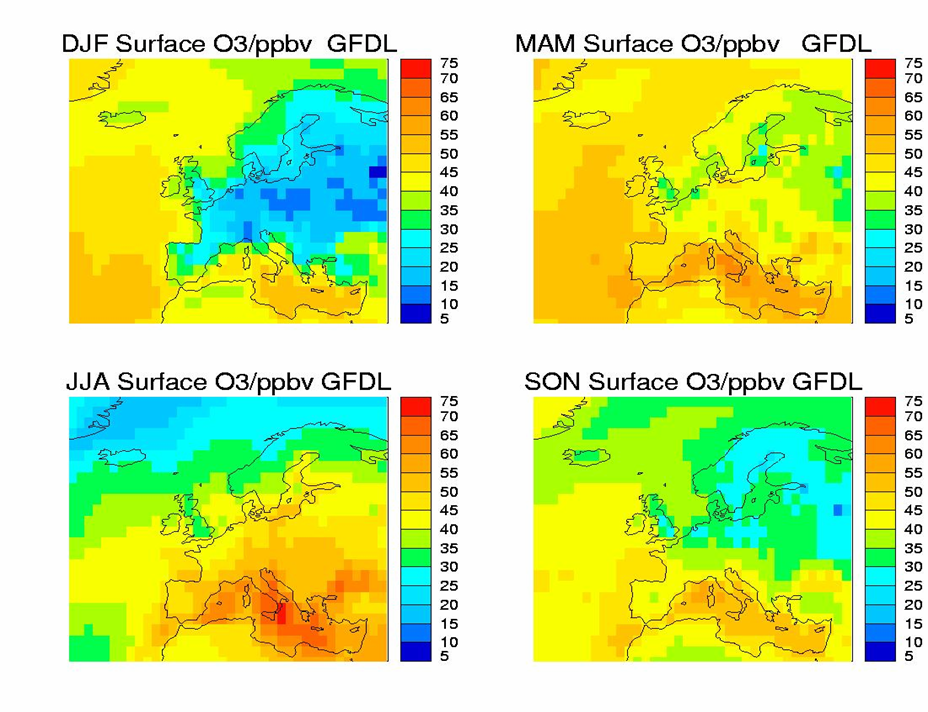
Figure 1 Model for Ozone And Related Chemical Tracers (MOZART) run at the Geophysical Fluid Dynamics Laboratory (GFDL). DJF= December, January, February (winter), MAM= March, April, May (spring), JJA= June, July, August (summer), SON= September, October, November (autumn). Winter and summer show the greatest contrast. (Courtesy of Arlene Fiore, GFDL; David Stevenson, GeoSciences, Edinburgh)
Ozone and Pressure
The following average pressure grids represent days during the winter and summer months when ozone, as measured at Eskdalemiuir, was either unusually high or unusually low. Note the differences in the prevailing wind directions during the two seasons.
High Ozone Winter
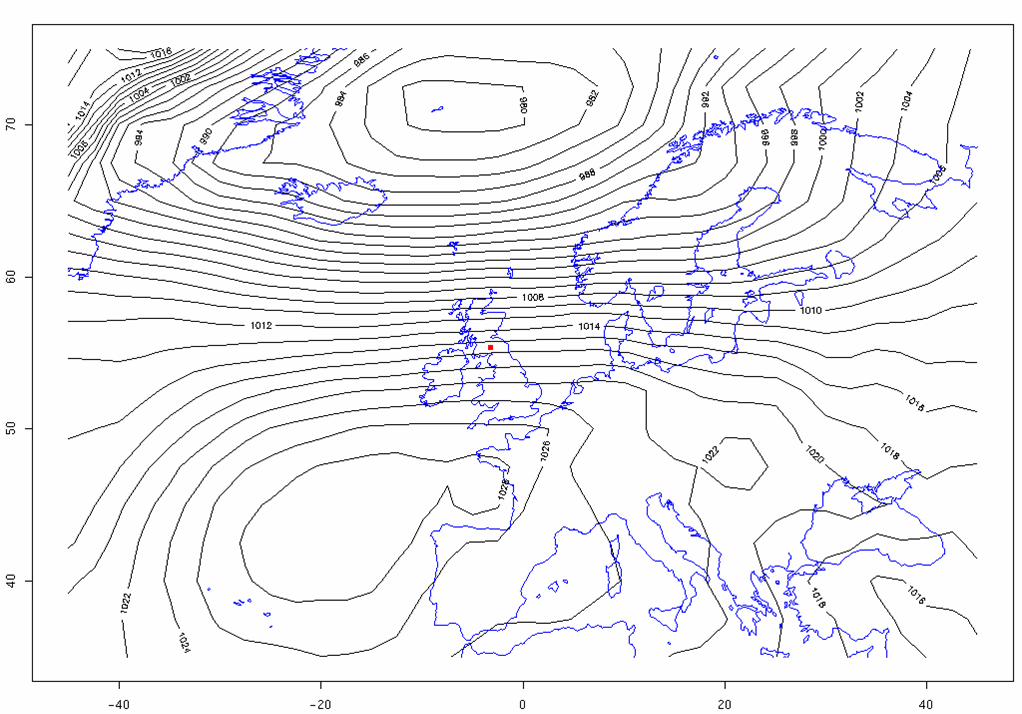
Figure 2: The average pressure in winter at times of high ozone levels. The red dot marks the observation site, Eskdalemuir. Isobar spacing is 2 millibars. In these winter months (December, January and February), a pressure low can be seen to the north of the British Isles, and a high to the south.There is a very steep gradient between these two pressure centres which is creating a strong wind dominantly from the west. This westerly wind comes directly from over the Atlantic Ocean, where the ozone tends to be higher than that over the continent during winter. Therefore, when the wind is westerly, it brings ozone to the British Isles causing a high at Eskdalemuir.
Low Ozone Winter
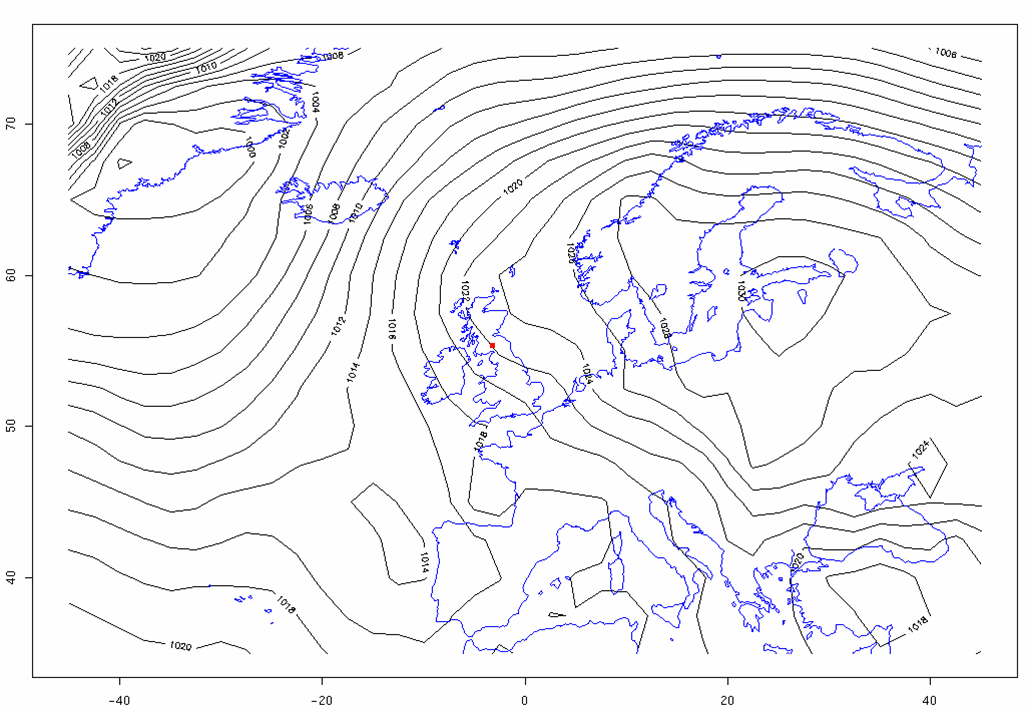
Figure 3: The average pressure in winter at times of low ozone levels at Eskdalemuir.
The pressure grid in Figure 3 shows a strong pressure gradient over the observation site. Together with the high and low pressure centres, the gradient creates a wind at Eskdalemuir coming from the southeast and south-southeast. As the ozone over continental Europe is at low concentrations at this time winds coming from this direction coincide with an ozone low at Eskdalemuir.
High Ozone Summer
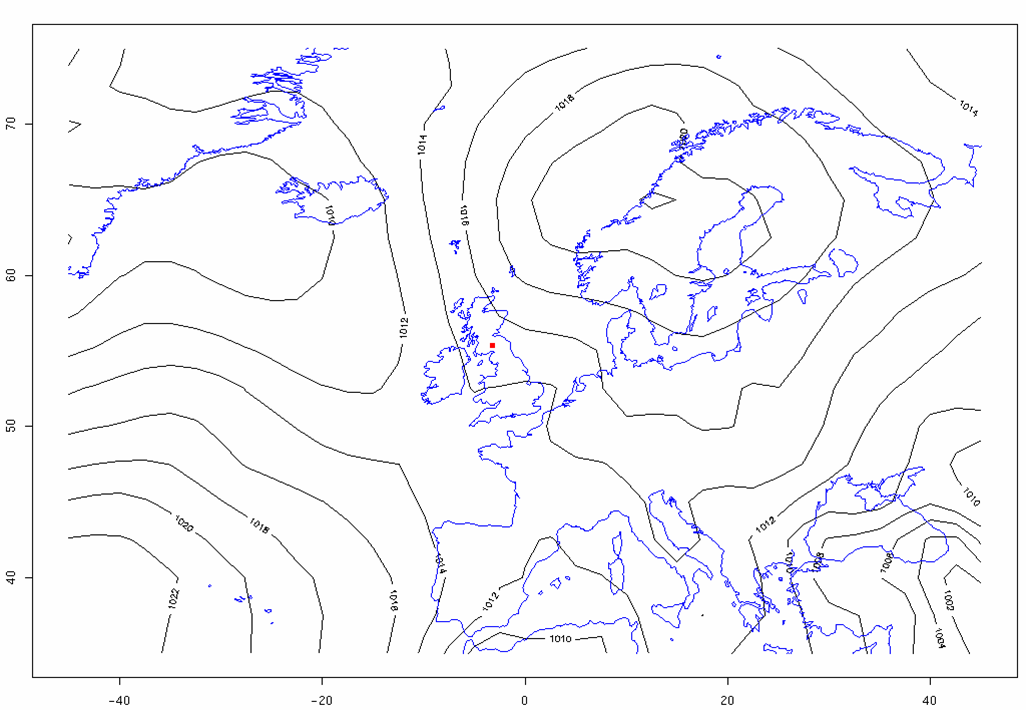
Figure 4: The average pressure in summer at times of high ozone levels at Eskdalemuir. In the summer months (June, July, August), the wind at Eskdalemuir during days with unusually high ozone comes predominantly from the southeast. This southeast wind is not as strong as the wind present during the winter, as shown by the wider spacing of the isobars. The wind is coming in from the continent, where there is a higher level of ozone than over the ocean in summer. Due to the relative weakness of these winds, the ozone in the atmosphere may become stagnant and contribute to the high ozone concentrations.
Low Ozone Summer
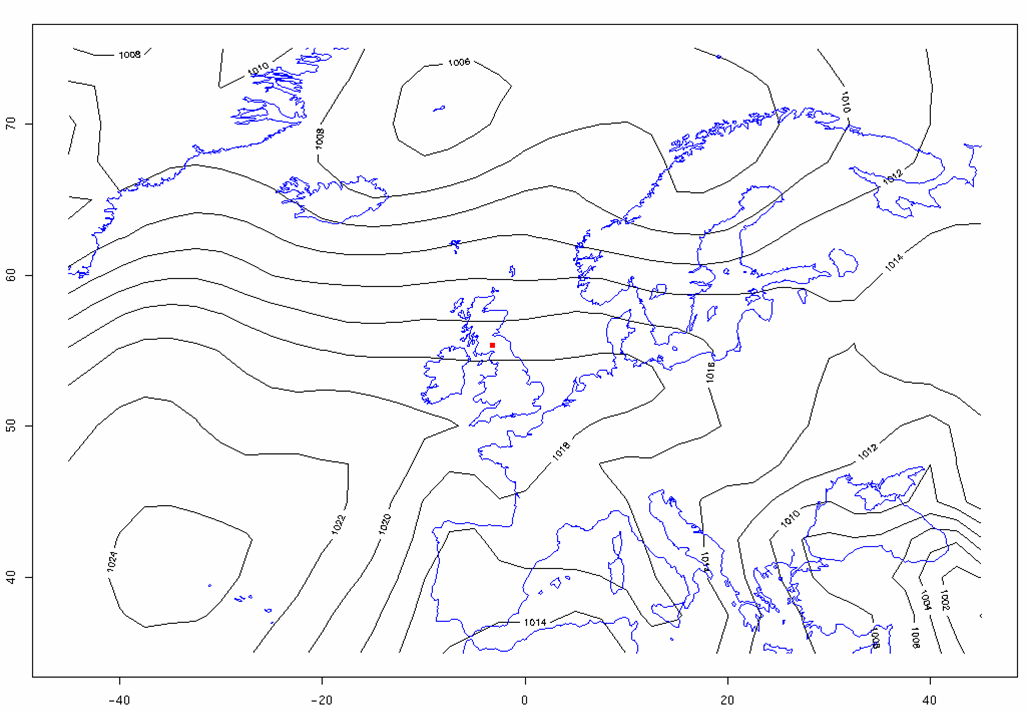
Figure 5: The average pressure in summer at times of low ozone levels. The red dot marks the location of Eskdalemuir. A high pressure ridge sits over England and the dominant winds come from west/west northwest. This situation can be compared to Figure 1, which shows there is an ozone low over the ocean in summer. Winds coming from the west are therefore expected to be carrying low levels of ozone to Eskdalemuir.
Conclusions
The main conclusion from this work is that atmospheric circulation has a strong role in modulating the surface ozone at rural sites in Scotland. During the winter months westerly winds (and a strong zonal flow) produce higher than usual ozone levels. By contrast, in the summer months high ozone levels occur when a Scandinavian high discourages westerlies and instead favours air-trajectories from England and the continent to continue across Scotland. We have found very similar results to those presented for Eskdalemuir at other rural sites, such as Strathvaich, and at coastal localities in Denmark and N Germany.
Based on a project by ASHLEY ANDERSON
Last Revised: Jan, 2020


Comments are closed
Comments to this thread have been closed by the post author or by an administrator.