
Induced seismicity Part 3: Update on Preston New Road seismicity
In this post, I will just update the plots I showed in Part 1 of this blog. It has been a little difficult as I am relying on information in the public domain – and there have been few authoritative statements made directly by Cuadrilla. I have tried to highlight where I have only partial information.
As always, I would like to highlight that I am not funded by any organisations involved in the operations around Blackpool and all the opinions expressed are my own.
The stem plot below shows the magnitudes with time for the last hundred days or so in the UK. The points with blue stems are those inferred to be at Blackpool by the BGS and are candidates for induced or triggered seismicity due to fracking operations, and the red stems show all other events in the UK, predominantly natural seismicity, though some may also be induced by other mechanisms – for example around abandoned or active coal mines.
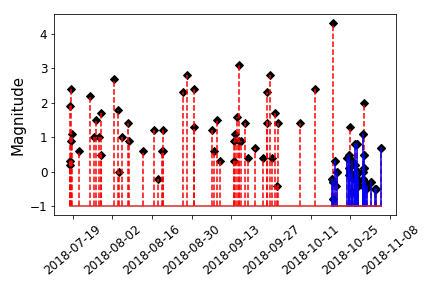
We can see the tight clustering of events in time in Blackpool. At first glance, the figure makes it look as though the event rate at Blackpool is higher than that of the seismicity in the whole UK. However, there is a cautionary note here. The BGS have deployed a dense seismic network around the Blackpool area so that they can record smaller events that they could uniformly record across the rest of the UK. This increased sensitivity in the network over-exaggerates the scale of the rate increase. Nevertheless, the induced seismicity is concentrated in a much smaller area (see the map in Part 1), so that the event rate per unit square kilometre really is much, much higher than that of the natural seismicity.
Now we will zoom in on the Blackpool sequence. In the diagram below the two narrow green time-slices represent times of injection that are well constrained from information in the public domain. The width of the lines corresponds to the reported duration of injection, and the edges are the start and stop times for injection. In both green time windows the end time determined by the traffic light system – i.e. there was a mandatory shut-in when a threshold magnitude was exceeded, so the diamond plots at the same time as the right hand edge of the green zone. The white regions are when injection was not occurring. The orange regions are periods where there may have been periods of injection, but we don’t know the detail. There are a lot of ‘trailing’ earthquakes after the magnitude 1.1.
In the last post I questioned whether a fixed period of rest of 18 hours was appropriate to manage the rate of seismicity. If we look at the seismicity that followed the largest magnitude 1.1 event, we can see a series of trailing events that lasted for a few days rather than just hours. Whilst the operators will have more information on this, this evidence suggests to me that a hiatus of only 18 hours would have been insufficient for the consequence seismicity to decay. Something worth exploring further as and when more information becomes available.
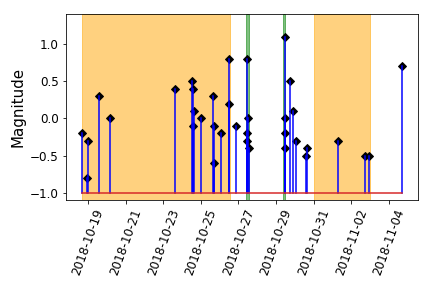
The Guardian reported this Sunday that fracking “has not triggered any tremors since Sunday 4 November, when a 0.7-magnitude quake was registered. As it happened at a time when fracking was not under way, it did not register as a ‘red light’ on the traffic light system of regulation.” The magnitude 0.7 event is shown in the figure above as the most recent one. It occurs in the white zone so is a trailing event, and hence could not have been stopped by ceasing injection. This illustrates how hard it can be to control events of these magnitudes simply by shutting down production under the traffic light system. It remains the case that there have been no further earthquakes recorded upto the 5th of November
The figure shows the frequency-magnitude distribution for both the whole UK catalogue for the 100 day period on the left and the Blackpool subset on the right. The graph plots a cumulative frequency, that is the number of events equal to or larger than a given magnitude plotted on the x-axis. The BGS website states that the UK catalogue in complete above magnitude 2.5 since 1979 (yellow line on lefthand figure below). This completeness threshold magnitude is shown by the vertical dashed yellow line below. Below this threshold we will have under-reporting of events – in fact all of the recent Blackpool events lie below where we have complete recording in the UK.
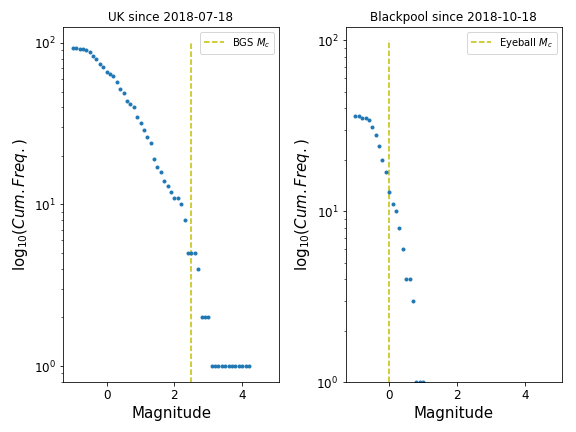
By design, the network installed around Blackpool is significantly more dense than the rest of the UK, so it has a much improved detection threshold. From the plot above, I would estimate the completeness threshold at Blackpool to be around magnitude zero as shown, but I may be wrong on this (I could not find a threshold quoted on the web). We can see that the minimum magnitude for the Blackpool events starts at  and that the largest event is the
  event. In contrast, for the rest of the UK the network records nothing smaller than
  . It seems a bit funny having a negative magnitude, but magnitude is a logarithmic scale, and it just means the radiated energy is less than some reference energy originally defined by Charles Richter when he first defined the scale. To give you a feel for this a magnitude -2 earthquake releases about as much energy as a brick being dropped from a height of one metre. We can still say that the largest event is around two magnitude units bigger than the smallest. Given one magnitude unit represents a factor 30 change in energy, this is equivalent to saying the biggest event released around 900 times the energy of the smallest.
It is clear from the information in the press and from the original seismic hazard assessment that Cuadrilla were not expecting to observed many, if any, events above  . They have had to modify how they are operating which may affect whether they can make the shale an economically viable prospect. It will be interesting to see the lessons learned regarding (i) whether/how they would recommend modifying the processes underlying the original seismic hazard assessment to reflect the increased likelihood of larger events, (ii) what information was missing from the original assessment, and (iii) what new constraints, if any, this experience puts on how this shale could be hydro-fracked to minimise the risk of larger magnitude events.
As new information becomes available, I may need to refine the information in this post. In particular, the date and time ranges over which fracking has occurred are not yet in the public domain and I am limited to using the BGS catalogue which has a much lower sensitivity than the microseismic array Cuadrilla will be using. It would be great if this information could be in the public domain for independent analysis.


Recent comments