As a physicist I have a (perhaps regrettable) tendency to regard geography as an alien subject: full of essay-writing and subjective opinions. But I do love maps. The part of the School of GeoSciences that houses the geographers has a lovely collection of old maps; when I have to visit this building I often end up staring at a map for ages. When I am to visit a new area my first act is usually to rush out and obtain maps of it.
One of the things I am looking forward to in the coming semester is the geophysics final-year field trip. We went to Germany last year, so it must be France this year. But we are not going to the part of France that we went to three years ago; the French organisers have organised a new venue: Montalivet-les-Bains in the Medoc peninsula. So it was time to go map shopping.
Ordinary topographic maps of France are easy to obtain. They are produced by the IGN and sold all over France and via a well-known on-line bookseller. The 1:25000 IGN sheets look rather old-fashioned to my eye; I think this is due to the solid black buildings which look like buildings on some of the older 1:63360 Ordnance Survey editions.
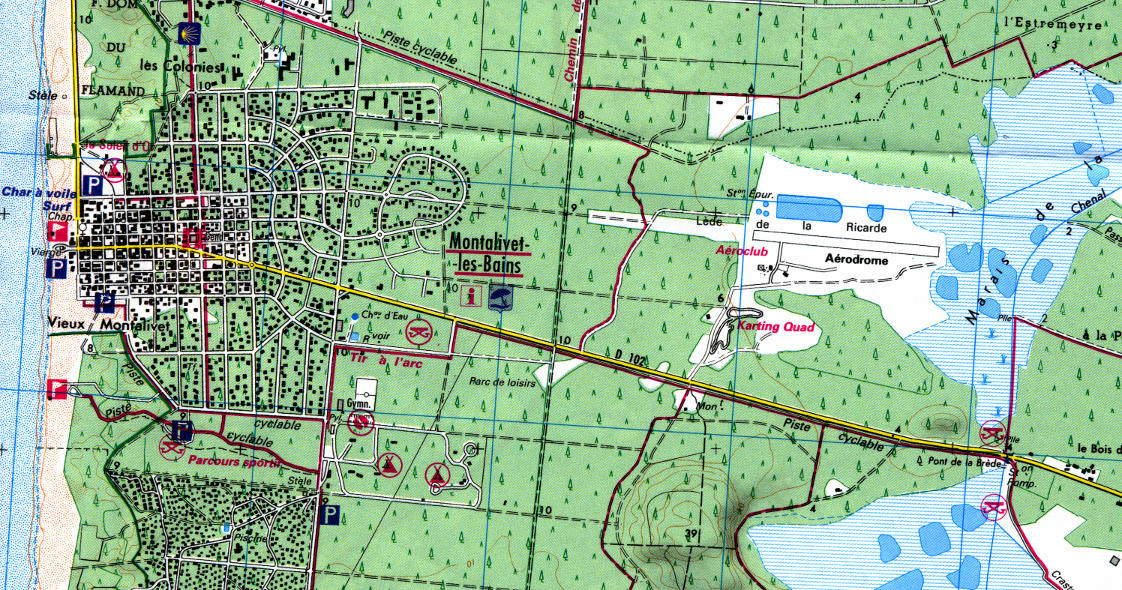
The IGN maps are just as detailed as the OS’s 1:25000 sheets, though. They are excellent for walking (those bright pink lines are walking routes) and should be good for geophysical surveying as well.
Geological maps are a slightly different story. They are produced by the BGRM and are available for the whole of France at a scale 1:50000. This seems to be a fairly recent situation; the series of maps was only finished in 2011 and replaces an earlier 1:80000 series. (France is ahead of Germany in this respect: the Germans have beautiful geological maps at 1:25000 scale, but when I tried to get one for the right bit of the Vogelsberg for last year’s trip it turned out the sheet had been out of print for ages.)
I struggled to buy maps from the BGRM’s web site, eventually obtaining them from another supplier (Unitheque). At 35 Euros per sheet they are not cheap, although you do get an explanatory booklet for each sheet and a generic booklet explaining how to read a geological map. For this reason it is worth knowing that you can get a good sneak preview at the infoterre website. You need to look under Donnes and then Cartes Geologiques, and then hit the link that says Accéder au contexte prédéfini Géologie et notices 1/50000. You then need to zoom in until the scale is either 1:25000 or 1:50000. If you can locate the map legend it even has a link for you to download the explanatory booklet (you are looking for a link that says notice). What you don’t get from this sneak preview is a decent legend; the pop-up legend is poorly colour-matched to the actual maps and is missing many elements. So if you really want to know what the map means, you need the paper copy.
As it happens, the Medoc peninsula is not the most exciting place, geologically.
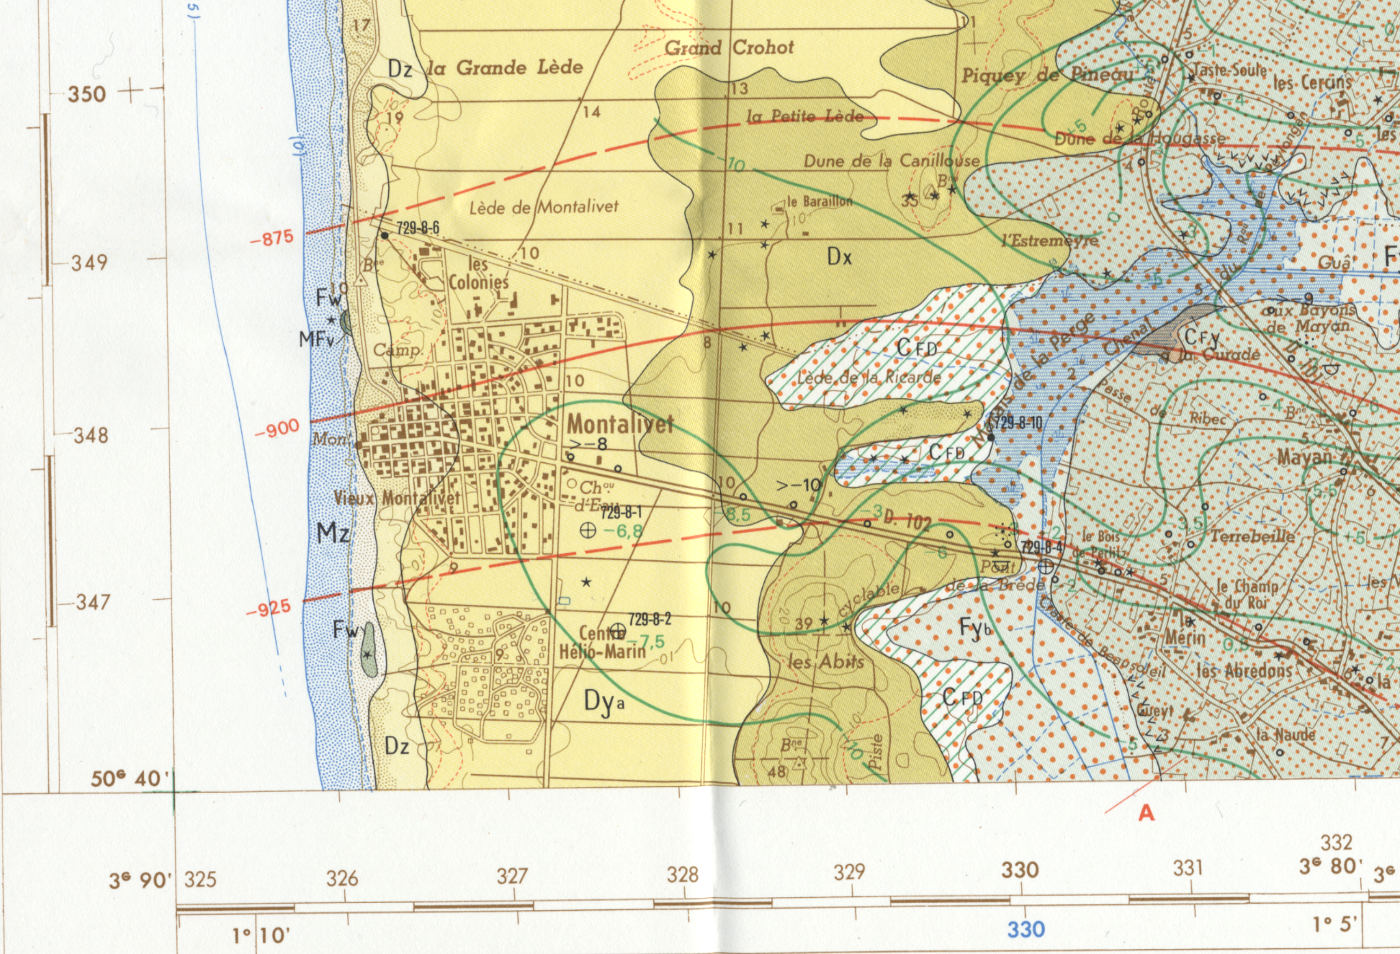
That beige stuff is two different ages of beach sand; the paler stuff is from historic times and the darker from the mesolithic period. The greyish stuff is river estuary deposits with the darker grey being older, but still only just back into the Pleistocene. Not a proper rock in sight and certainly no basalt. I think that the main thing that the magnetic survey can hope for is to find is the secret location where a farmer decided to inter a dead tractor. I imagine that all of our other survey techniques will be able to find something, but we won’t know until we try — this is one of the delights of taking a field trip to a new site.
The various numbers down the edge of the map are one of the constant joys of French maps: a riot of warring co-ordinate systems. The marks at 1°5′ and 1°10′ are degrees and minutes of longitude west of “Le Meridien International”, i.e. Greenwich. But the marks at 3G80` and 3G90` are grads and decimals of longitude west of Paris; a grad (or gon) being a one-hundredth of a right-angle. The dark and white bars are tenths of a grad in this co-ordinate system. The metric-ising fervour of the French revolution has clearly left its mark on maps as well as on the ground they are mapping. The brown and blue numbers in the 300s are two different 1-km grids using a Lambert conical projection optimized for two different regions of France. Neither of them is the UTM grid which appears as blue lines on the IGN maps and which we will be using as the co-ordinate system for the field trip.


2 Replies to “Maps, maps, maps.”