Some of my current weather data is hidden away on my internal current weather site. (To access this you have to be a University member and log in through EASE.) My current weather figures that are made available to the whole web are on this page.
METAR plots
These are useful when the University’s weather station is not working.
- A plot of recent data from EGPH, the Edinburgh airport weather station.
- A record of METAR data from Edinburgh at the times of the Met:W+C labs.
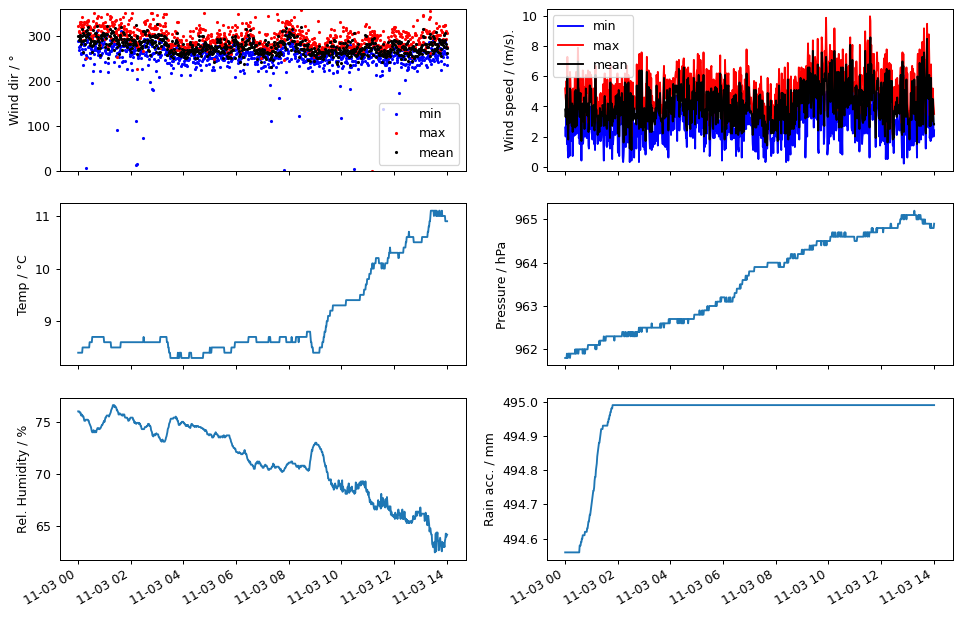
GeoSciences weather station
The station is located on the roof of the James Clerk Maxwell Building at on the Kings Buildings site. The data are plotted at 1 minute intervals; the plots are updated every 10 minutes. These plots are experimental, they may be changed, improved, moved somewhere else etc. without warning. The plots were unavailable for many months due to the roof being made of RAAC. They are available again as of 2024-12-11.
An archive of the data from the weather station is available. There is one gzipped CSV file for each day; the archive starts in March 2021. There are plots produced by the IT team who maintain the station, but they do not include wind or rainfall.
The archive from a previous weather station is also available .
NOTICE regarding use of NOAA data
Both the weather charts and the back-trajectory plots depend on the NCEP GFS analysis data . NCEP (National Center for Environmental Prediction) is part of NOAA (National Oceanic and Atmospheric Administration); many scientists at NOAA are currently being sacked by Donald Trump’s administration. For this reason the following two items are at risk and may cease to be available without notice.
My rolling archive of weather charts
These charts are made from GFS analyses, downloaded from the CISL Research Data Archive There is a separate folder for each date, with a variety of charts. Once the day is complete there should be four of each sort of chart per day, for the times 0, 6, 12 and 18 hours GMT. All file names contain the date. The sub-folder “local” contains duplicates of charts from elsewhere on the web — these are only accessible to University members.
My rolling archive of back-trajectory plots
These plots are made using the FLEXTRA trajectory model, driven by NCEP GFS analyses. There are plots for all of the UK radiosonde launch sites, and for a few other locations. Each plot shows where the air arriving at the station came from. The dots on the curves are at 6-hour intervals.
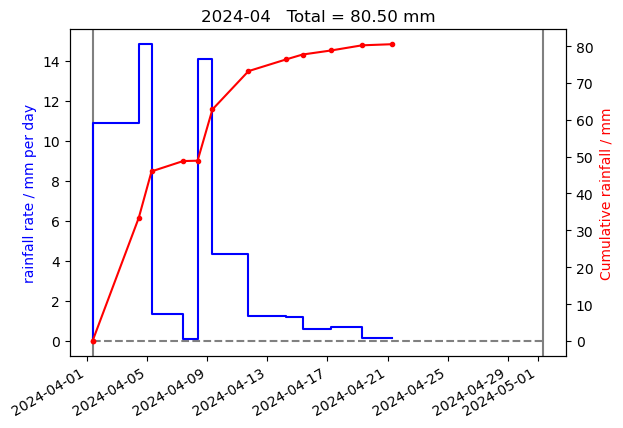
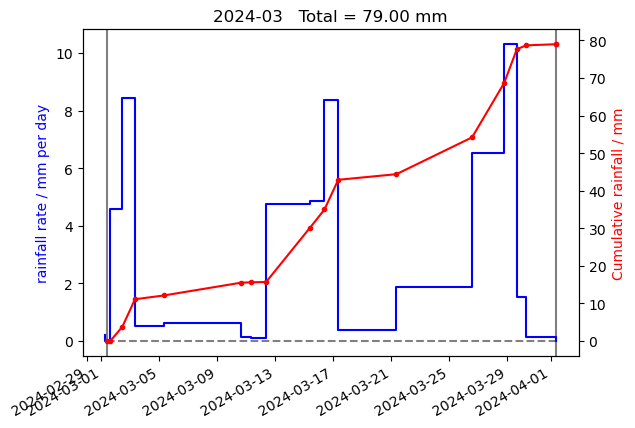
Dunbar rainfall plots
Plots of the rainfall measured in Dunbar for the current month, the previous month, and the month before that. There is also a summary bar chart of monthly totals and a cumulative plot showing each year separately. These plots get updated at random moments when I feel like it; see this blog post for more details.
Animations of vorticity and divergence
These are also made from GFS analyses, downloaded from the CISL Research Data Archive. The individual frames are in the rolling archive. There are separate animations for three levels:
Links to other sources of current weather data
- On the School web site
- The webcam page (Currently broken)
- The weather station page. (Also currently broken. Substitute plots at the top of this page.)
- Elsewhere
- The Met Office
- The Free University of Berlin provide charts with names for every cyclone, including the latest analysis and the latest forecast.
- Montreal-based metocentre.com provide a variety of charts.
- www.wetter3.de provide animations of a wide range of charts.
- Surface Radiation budget data
- EUMETSAT for geostationary satellite pictures
- Radiosonde soundings from University of Wyoming