Any views expressed within media held on this service are those of the contributors, should not be taken as approved or endorsed by the University, and do not necessarily reflect the views of the University in respect of any particular issue.
Digimap is an online map and data delivery service, available by subscription to UK Higher and Further Education establishments. Operated by EDINA at the University of Edinburgh, Digimap offers a number of data collections, including Ordnance Survey, historical, geological, aerial photography, LiDAR, marine maps, land cover mapping, global mapping and census data. For more information about Digimap go to our website: https://digimap.edina.ac.uk Background image Contains OS data (c) Crown Copyright and database right 2022
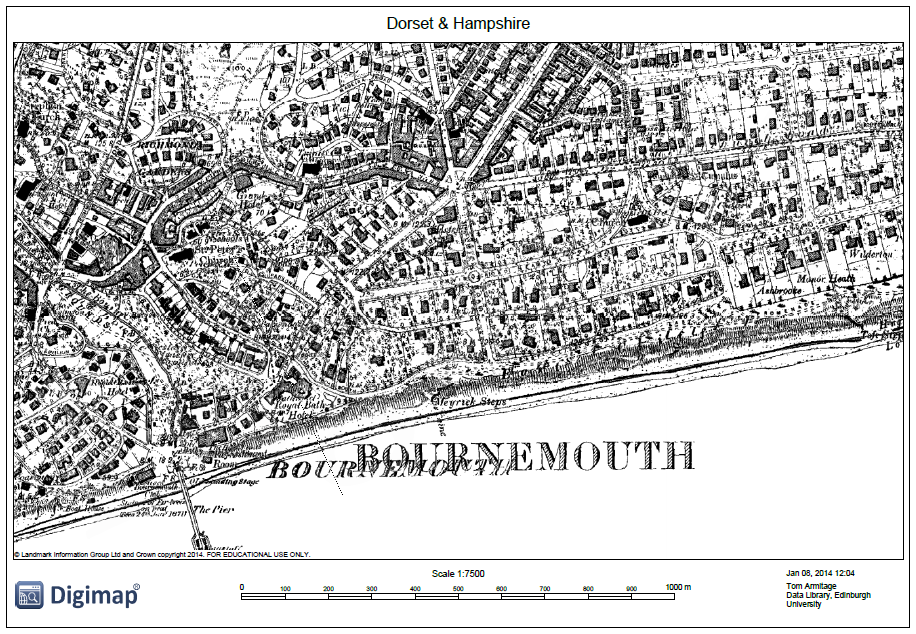
Ancient Roam in Historic Digimap has had its print options updated so it now has the same set of options as the other Roam facilities. The two big changes to note are that you can now print up to A0 and that you can print a single county in areas where several overlap.
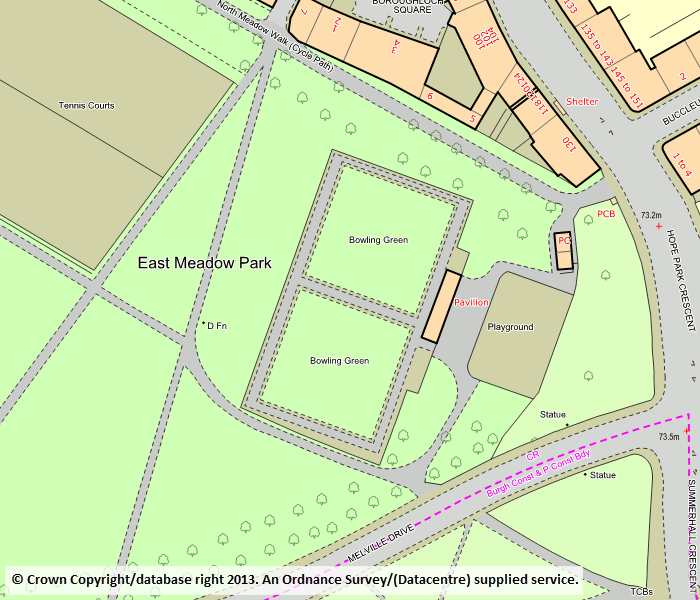
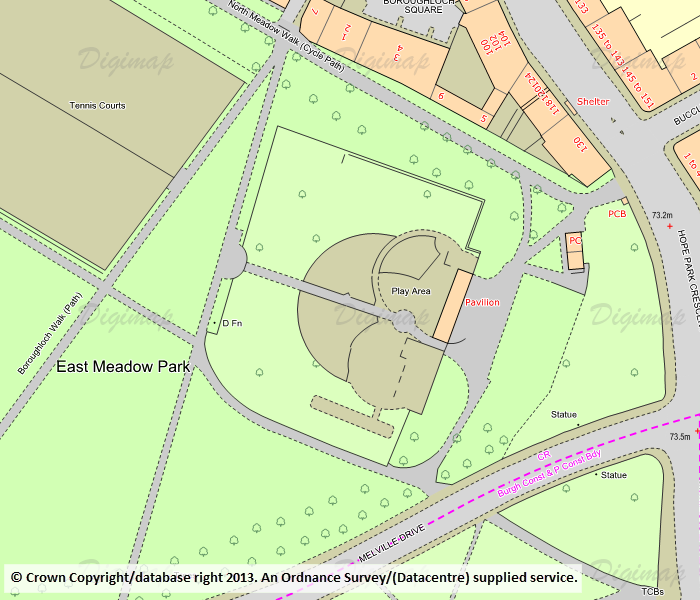
Until this change was made it was impossible to print an area with overlapping maps without printing all the counties available rather than just the one(s) you were viewing on the screen. Any print files now generated in areas with overlapping counties will only show those which are displayed on screen. This allows you to have the control over how much information is on your map and to make the decision to show more or less information.
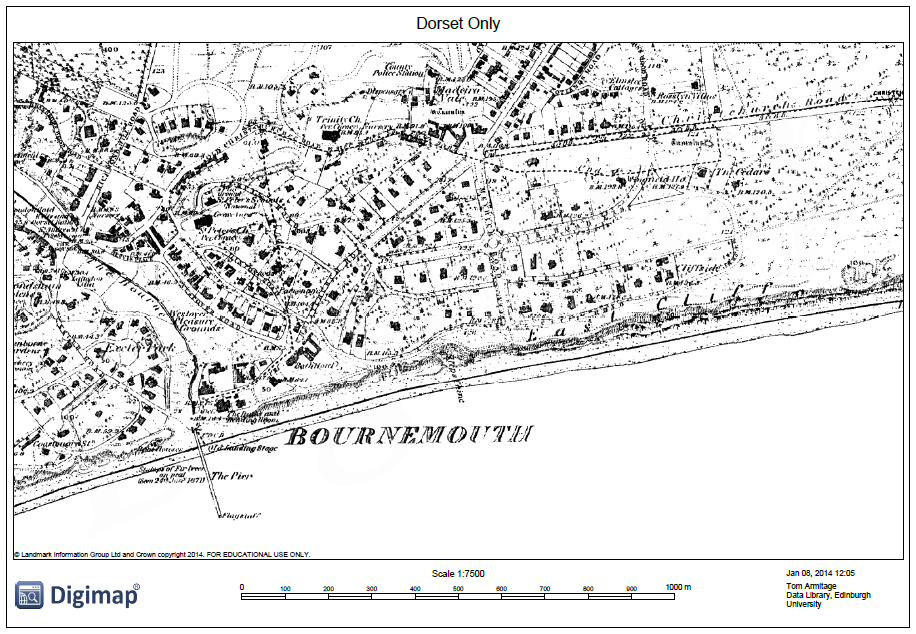
Sometimes it can be an advantage to show multiple counties as even though the sheets overlap the actual map information doesn’t. However in the example above you can see how the counties overwrite each other in the map on the left and so produce a very confusing and fairly useless result; by switching one county off you can produce a much clearer print map such as the one on the right. [Click on the images above to view larger versions of the maps.]
The ability to print maps up to A0 brings Ancient Roam into line with the other Roam facilities so you can now print at this very large size in any Digimap collection.
EDINA currently uses the time between 17:30 and 18:30 on Tuesdays as its “At Risk” period for carrying out service maintenance to Digimap. From January 2014 we will be changing this to a morning slot, between 08:30 and 09:30 on Tuesdays, allowing us more time to resolve any issues that may arise due to the scheduled work.
Increasingly the maintenance work has been causing less and less disruption to the service as we are able to switch to different servers. Moving to a morning downtime allows us to further minimise any potential disruption because staff are more readily on hand during normal working hours.
We hope that this change doesn’t cause any disruption to our users, please let us know if you have any concerns:
EDINA has updated the most detailed maps in Geology Digimap to the latest version from the British Geological Survey (BGS). The 1:50,000 scale maps and data in Geology Roam and Geology Download are now the DiGMapGB-50 Version 7 data from the BGS.
The main differences between this data and the previous versions is that there is an extra tile of data in Wales, EW150 Dinas Mawddwy, and that the linear features are now contained in a single shapefile rather than being in several separate layers. The 7 different linear feature layers; Alteration, Fault, Fold Axis, Fossil Horizon, Landform, Mineral Vein, and Rock are now all combined in a single Linear layer.
The following tiles have all undergone major changes:
Scotland
SC008E_Loch Doon (Superficial)
SC016E_Ettrick (Bedrock)
SC073W_Invermoriston (Superficial)
SC084E_Nairn (Bedrock)
SC092E_Loch Fannich (Bedrock)
SC101E_Ullapool (Superficial)
SC102W_Oykel Bridge (Bedrock)
SC108W_Ben Hee (Bedrock)
England & Wales
EW039 Kendal (Superficial)
EW075 Preston
EW085 Manchester
EW086 Glossop
EW100 Sheffield
EW112 Chesterfield
EW150 Dinas Mawddwy
EW167 Dudley
EW174 Thetford
EW203 Bedford
EW224 242 Colchester Brightlingsea
EW247 Swansea
EW265 Bath
EW283 Andover
EW310 Tiverton
EW346 Newquay
For more details about the 1:50,000 and other DiGMapGB datasets you can download the Information Notes directly from the BGS: DiGMapGB Information Notes
We are often asked whether Ordnance Survey maps from Digimap can be published on the web and whether the Digimap licence allows this. The simple answer is yes, but there are (as always) caveats. The most obvious one is that any maps from Digimap that you publish on a website must relate to your academic work. That applies to the use of Digimap, regardless of what you do with the maps or the service.
The section of the Ordnance Survey Licence you need to look at is Schedule 2 of the Second Variation Agreement. This was originally called Appendix 4 under the original 2007 – 2009 licence, but has since been superseded by the first and second variations. You can find all the licence documents online here:
If you wish to publish a static image on your public-facing, “open to the world” website, you may do so on condition that the image is no bigger than 1 048 576 pixels. This is the equivalent of a square 1024 x 1024 pixels.
If you wish to publish a static image on an intranet page, that is, a website with access restricted to members of your institution, there are no restrictions on the size of the image you can use.
You can publish as many images as you wish, as long as each one is less than 1 048 657 pixels (1024 x 1024 or equivalent).
Interactive Mapping
A more common and complex question is whether you can put up a “zoomable” map with your own data overlaid on it. If this is what you wish to do, you need to consider the following stipulations in the licence:
When rendering mapping on a website:
Only Digital Maps may be published. Digital Data and mapping in GeoPDF format may not be published at any time.
It must only be available as an image and not be accompanied by drawing or measuring tools.
It is permissible to zoom in and out to enlarge or reduce the viewing scale of a discrete map image but not to change from one dataset to another of higher/lower resolution.
It is permissible to pan to the edge of a discrete map image (where the ‘viewing frame’ is smaller than the overall image).
Digital Maps may be displayed at any size on screen.
More than one Digital Map may be included but no single Digital Map may be of a size greater than specified above.
Note that “Digital Maps” is a capitalised term and is specifically defined in the licence agreement. The definition given is: “any or all of the maps created by a Datacentre from the Licensed Work to be used in a Service provided by a Datacentre.” In essence this means any map created by Digimap which is “non intelligent”. That is, it contains no vector data, cannot be interrogated to extract data of any sort (in the same way as one might interrogate a satellite image to identify the spectral signature of a particular pixel), and is a dumb image.
Given these stipulations, you are not permitted to use the Ordnance Survey licensed data available through Digimap to display a series of maps using different OS data products which the public can zoom in and out of, pan around the whole country and add their own markers to, in a similar way to many other online mapping services (such as Google Maps or Apple Maps or OpenStreetmap). Note that this does not apply if you wish to use the OS OpenData, which is also available through Digimap.
Alternative Sources of Mapping
If you do wish to create an interactive mapping function on your website, you might like to consider the alternatives to using licensed Ordnance Survey data. EDINA operates a free service called OpenStream which provides OS OpenData through an API. You need an academic email address to register for OpenStream (ending .ac.uk) , but it doesn’t cost. The maps area available under the OS OpenData licence and the licensing terms are therefore much more flexible than the data licensed through Digimap.
As ever, if you have any questions about what you can and cannot do under the Digimap licence, please do not hesitate to contact EDINA with details of what you wish to do, what data you wish to use and who you intend should benefit from your work. We are keen to hear of licensing questions you would like to see explained further on this blog.
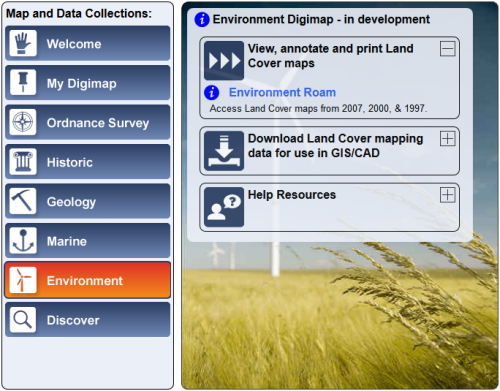
EDINA and Jisc are pleased to announce the launch of a new Digimap Collection, Environment Digimap.
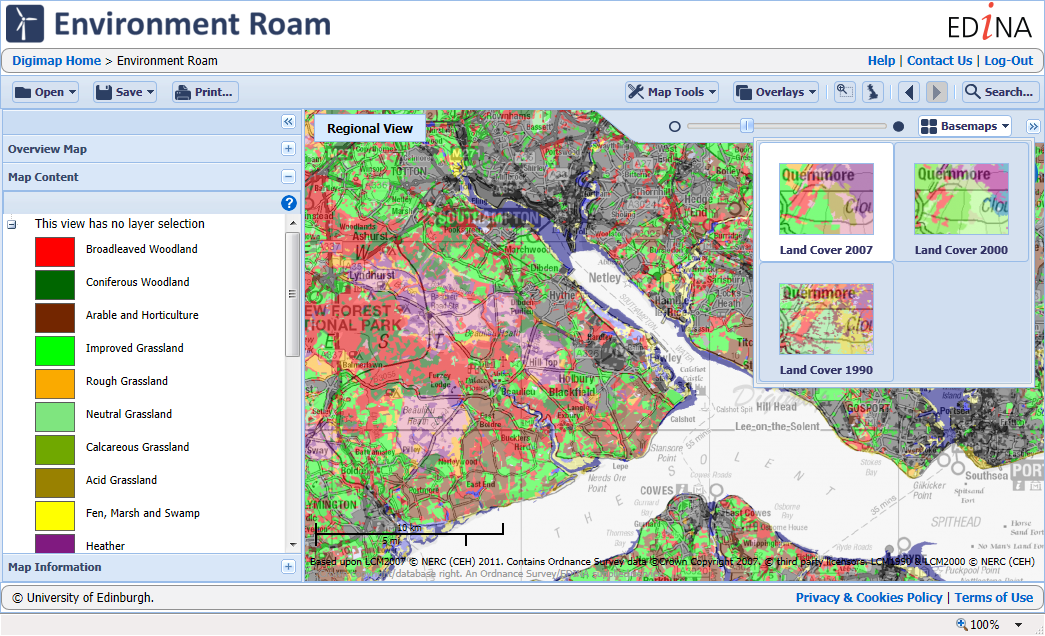
This new collection offers land cover map data from the Centre for Ecology & Hydrology (CEH). Environment Digimap is a subscription service; however, it will be available free of charge until 31 July 2014. After this period a subscription fee will apply per institution.
Environment Digimap offers two facilities: mapping through Environment Roam, and the ability to download data through Environment Download. The data available, CEH’s Land Cover Map products, provide a snapshot of land cover for each of the years 1990, 2000 and 2007. There are raster datasets available at 25m and 1km resolutions for each year and a vector version of the 2000 dataset. The data are in a range of formats depending on the year. More details are available in the Environment Digimap Help Pages: CEH Products Available
How to get access…
To use this service for free your institution needs to subscribe, this is free till the end of the 2013 – 14 academic year and can be arranged via the Jisc Collections website:
If your institution doesn’t subscribe the Environment Digimap button on the home page will be grey. Contact your Digimap site rep and they will be able to help arrange your institutions subscription: List of Digimap Site Reps
If you have any questions about Environment Digimap, please contact us:
We have updated three of the mapping datasets in Digimap Roam, so you can now view mapping published as recently as June 2013.
The products updated are:
OS MasterMap: used in the three most detailed zoom levels in Roam.
OS VectorMap Local (VML): the next most detailed maps in Roam, available as alternate “Basemaps” in the 4th and 5th most detailed zoom levels.
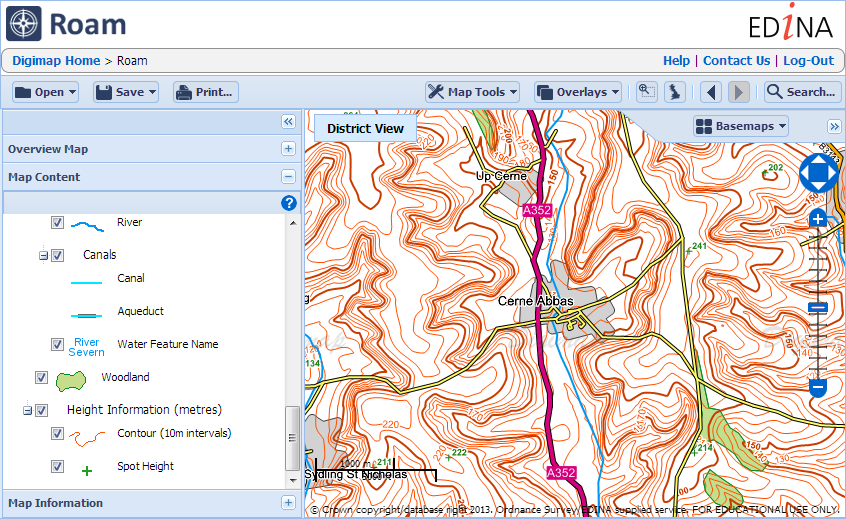
Midscale Maps: These maps are made of the Meridian 2 mapping data along with contours. Until now they had been made with Land-form PANORAMA data, but now they use the new OS Terrain 50 contours:
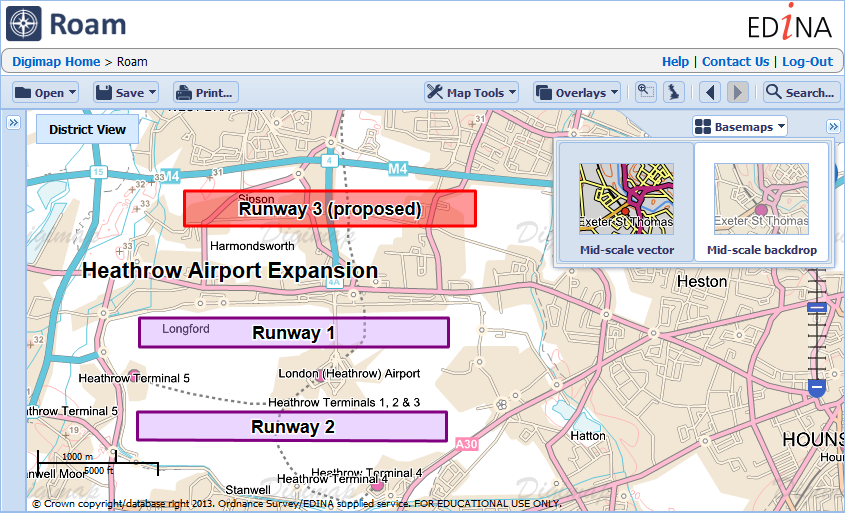
These midscale maps are also available in a backdrop colour scheme which can be accessed by using the Basemaps tab at the top right of the map. The faded colours allow your annotations to show more strongly:
The updated datasets are also available from Digimap’s Data Download service (except MasterMap which will follow in the next few months), a page in Digimap Help details the all the OS products available and their currency in Roam and Data Download:
October is the busiest time for welcoming new users to Digimap and we have already approved over 7500 registrations. As you know it is important to enter a valid email address when registering; this is how we send you a link to your data downloads and how we inform you of any changes or disruptions to the service.
We ask you to give us your academic email address where possible, we know for some this isn’t most commonly used address so please check that you have entered it correctly. Quite often the email address entered seems correct but is missing a particular element, for example:
We get: j.bloggs@university.ac.uk
We need: j.bloggs@student.university.ac.uk
Please make sure that you don’t miss out any parts of the address, you can try sending yourself an email to see if it is right… and it is always worth another check for typos.
Over 2012/13, EDINA conducted user satisfaction surveys for its Jisc-funded services including the four Digimap collection.
A large majority of the respondents found our services easy to use, saved them time and would recommend them to others. The survey results can be found for the services here:
We also examined some of the less positive feedback and suggestions made by our users to improve our services. We have summarised these suggestions in tables, along with our responses and actions, and graded them using the following formula:
Done or due for release soon
Do soon, requires little resource
Already planned
Put on to-do list, needs more effort
Not achievable or beyond scope
The tables report the grades allocated and, where applicable, the explanation of why we have given them that grade:
All the Digimap Roam interfaces are due to change this August, with the provisional date set to Tuesday the 13th. There are three specific changes that all existing users of any of the Roam interfaces need to know:
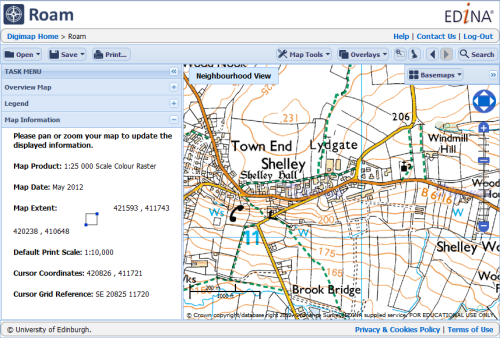
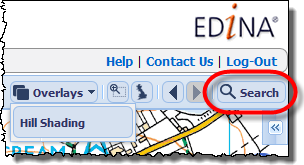
To search for your chosen location you now click on the Search button found above the map on the right-hand side.
Once you have clicked the Search button a new window will open allowing you to do a simple search for a place name or postcode, or a more advanced search using coordinates on either the British National Grid as a grid reference or Eastings and Northings, or as Latitude and Longitude values.
Print Changes
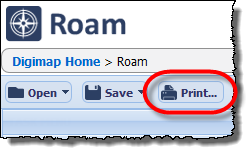
To make a PDF, PNG or JPG print file of your map you now click on the Print button which can be found above the map on the left-hand side.
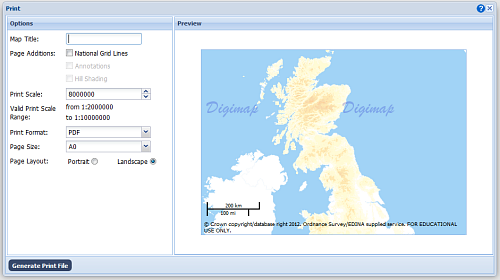
Once you have clicked the Print button a new window will open allowing you to change the print options such as paper size, orientation and scale.
Once you are happy with the settings click Generate Print File, you will be asked to save the file created in the usual way for your browser.
Opening and Saving Maps and Annotations
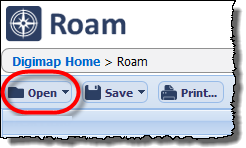
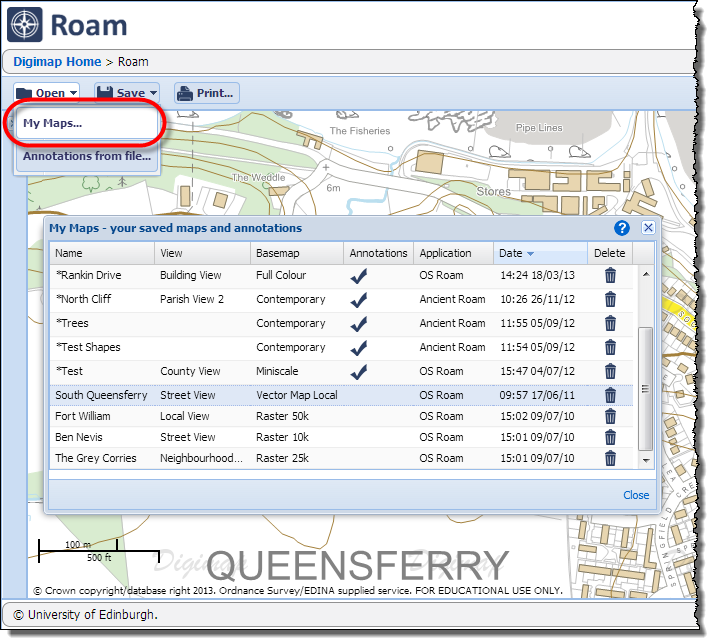
Don’t panic! All your saved maps and annotations from the previous version of Roam will all still be available. To open existing maps or annotations click on the Open button and then My Maps… Once you have clicked on the button a new window will open that allows you to access all the maps and annotations you have saved in any of the Roam interfaces. Annotations are now saved as part of your Map!
In this window you can choose your map and also delete ones you no longer need. If you made a map in a different Roam, opening it will take you to the location and the equivalent zoom level. If it had Annotations, these will be drawn on the new map.
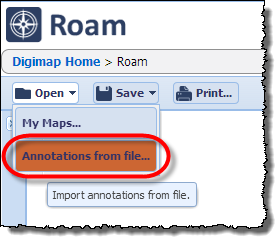
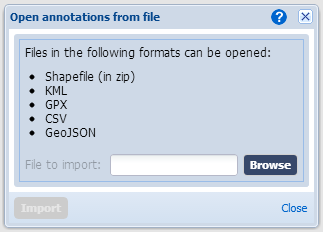
The Open button also allows you to import annotations from a file saved on your computer. Click on the Annotations from file… option to open a window where you can specify the file you want to upload.
When using the service you can click on the blue question mark icon for help on how to use this feature.
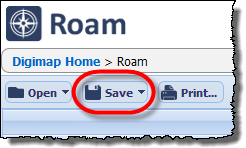
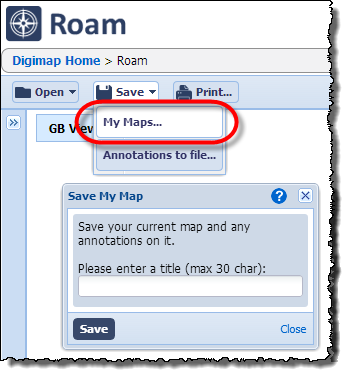
When it comes to saving your maps and annotations you now just click on the Save button and again pick the My Maps… option. This will open the Save My Map window where you save both the map and any annotations that are on it.
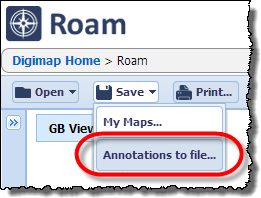
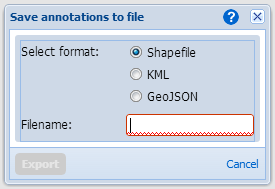
In a similar way to importing annotations, to Export them to a file you click the Save button and then choose the Annotations to file… In the window that opens select the format of the file you want to save and give it a name; clicking Export will then download the file to your web browser’s usual location.
Other Changes
There are several other changes to the interface that make it easier to use some features of Roam that you may have missed in the past, see this previous blog post for more information: