The new Ordnance Survey Licence includes some new and very interesting datasets for the Digimap service. We have already added OS Terrain 5, Ordnance Survey’s most detailed digital terrain model and contour data to the the Data Download facility. The other new datasets will require some additional effort to add into the service but we should have them available to download early in the new year. These new datasets are as follows:
OS MasterMap ITN Urban Paths
Routing information for walkers and cyclists in towns and cities.
More Info from Ordnance Survey…
 OS MasterMap Sites Layer
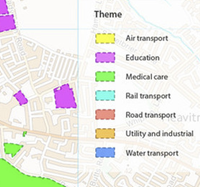
Identifies areas as being in categories such as schools, hospitals, transport facilities etc. The data also highlights access points to the sites and routing destinations for more accurate travel distances.
More Info from Ordnance Survey…
Points of Interest
Over 4 million points of interest classified into 3 tiers; 9 groups, 52 categories and 616 classes. The points of interest include accommodation, eating and drinking, commercial services, attractions, sport and entertainment, education and health, public infrastructure, manufacturing and production,retail, and transport.
Please note that Points of Interest data is made available under slightly different terms to the other Digimap Ordnance Survey datasets. Please see the EULA and FAQs for further details.
More Info from Ordnance Survey…
EDINA has had many requests for these datasets, especially the Urban Paths so we are very pleased to be able to offer them to you. We also intend adding some of these datasets to Digimap Roam so that they can be added to the maps you view and print as well.
Please contact the EDINA help desk if you want access to the datasets mentioned above before they are made available in the Data Download service:
- Phone: 0131 6503302
- Email: edina@ed.ac.uk