As per last year I am starting the year with a report on the rain I recorded in Dunbar.
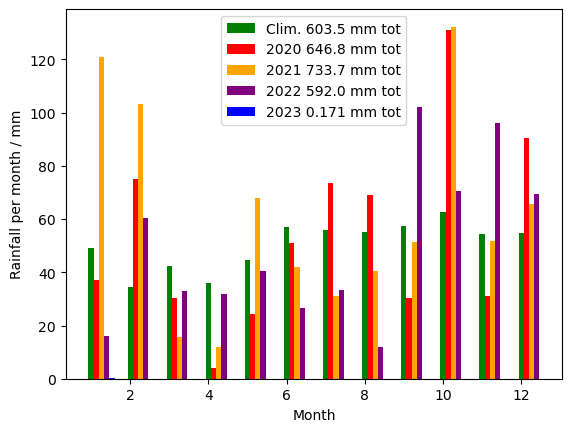
It will not surprise anyone who has been listening to the news that 2022 was a dry year: slightly drier than the climatological mean and considerably drier than either 2021 or 2020.
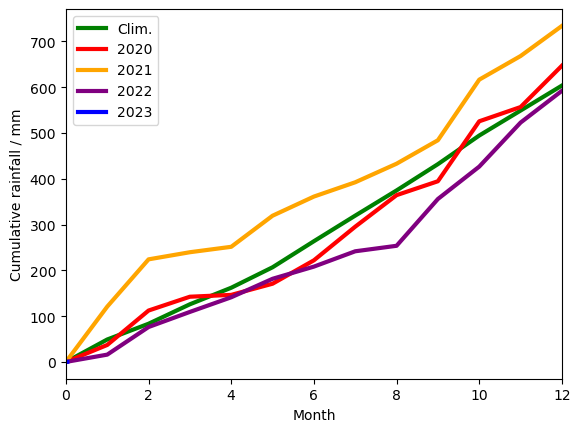
It is clear from the bar chart, and perhaps even clearer from this cumulative plot, that the deficit mostly occurred over the summer; the cumlative total was more than 100mm below the climatological mean by the end of August. A consistently wet autumn meant that the deficit by the end of the year was quite small.
If you do not want to wait a year for another update, you can find (fairly) regularly updated versions of these plots on my current weather web page.

