A few months ago a family heirloom was passed on to me to take care of: a mercury barometer. , originally the property of my great grandfather, Dr William Hobson Mills of Jesus College, Cambridge. Getting it home was a bit of a nail-biting experience. You can not lie the things horizontally or the mercury may escape from the reservoir at the bottom. But you also can not hold them vertical to transport them or the mercury column will be jogged up and down as you walk, and can allow air into the glass tube, or even break it. The instrument has to be tilted over at about 30° to the vertical so that the mercury reaches the top of the tube. It is then fairly safe to move, but I have still never felt so relieved as when I got the thing into my house with the glass unbroken and the toxic, messy mercury unspilled.
Once it is hung up safely on a wall, there is not a lot to go wrong with a mercury barometer. If you can see the mercury column near the top of the tube, where the scale is, then the instrument more-or-less has to be working, it is not as if there are any solid moving parts to get stuck. Nevertheless, I felt the urge to check it against something. The most easily-available something is the Met Office’s forecast charts, so I used those. Whenever it occurs to me I read the barometer and estimate the sea-level pressure at the same time from the charts. The resulting data table looks like this:
Time             pr     prErr  inHg
2021-09-03T08:10 1026.0   1.0    30.45
2021-09-03T12:00 1025.5   1.0    30.42
2021-09-04T09:40 1020.6   1.0    30.28
2021-09-04T19:00 1020.0   1.0    30.24
2021-09-05T07:46 1020.5   1.0    30.25
2021-09-05T18:00 1020.5   1.0    30.25
2021-09-09T12:00 1007.75  1.0    29.87
.
.
.
Here, the “pr” column is the pressure estimated from the forecast charts (in hPa); The “prErr” column is my estimate of the interpolation error. I don’t think I can do better than 1 hPa, but if the isobars are close together, or if the recording time is not close to one of the synoptic times ( midnight, 6 am, 12 noon, 6 pm) the error is larger. The “inHg” column is read from the barometer. Given that it was made in the early 19th century in England it is unsurprising that the scale is in inches.
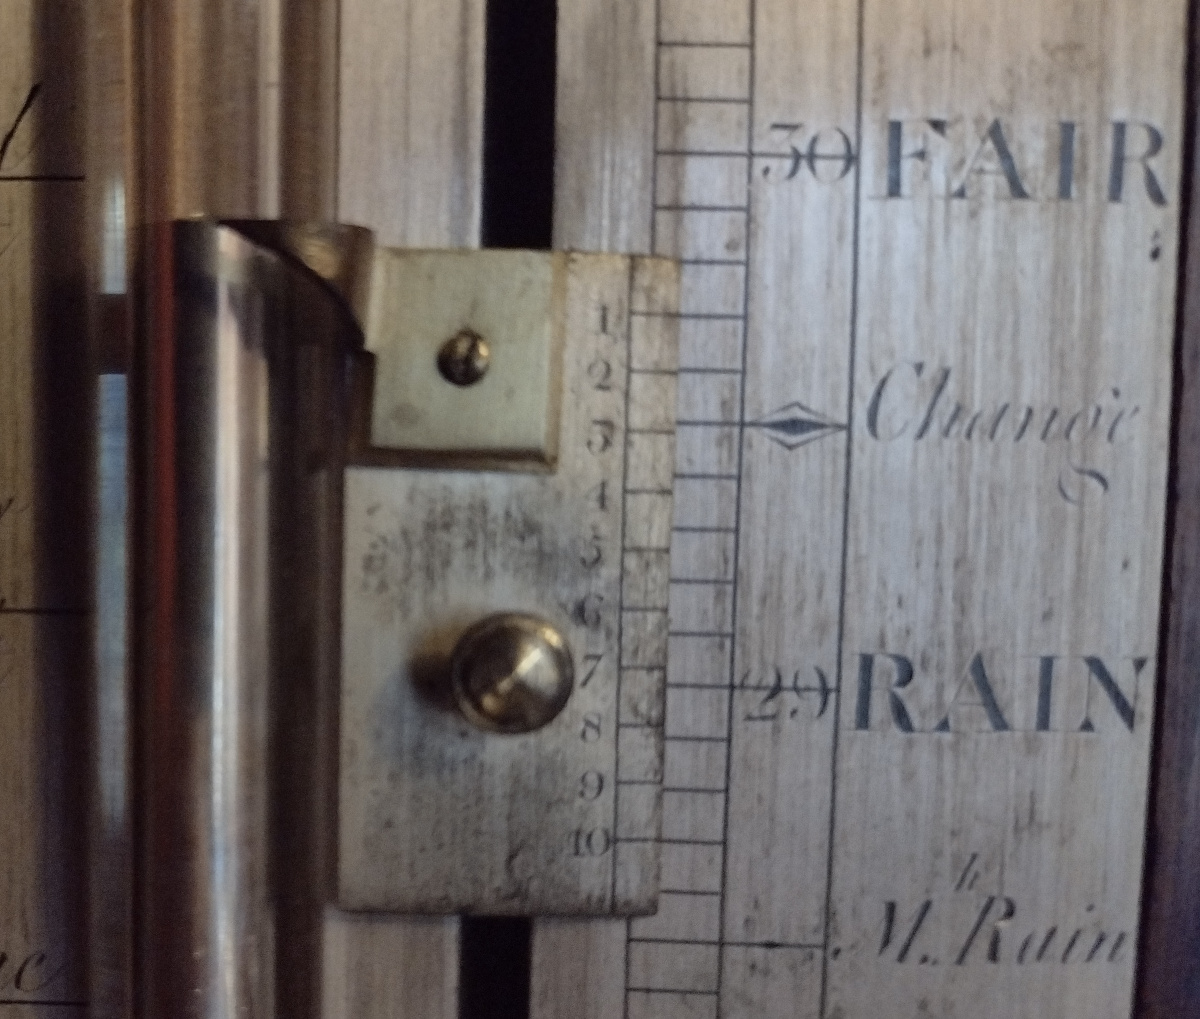
As is also usual on stick-type mercury barometers it has that magical device: a vernier scale. This allows it to be read to a precision of 1/100 of an inch.
To compare the barometer with the Met Office forecasts, the data file is read into python, the inches of mercury are converted into hPa and a scatter of the data points is plotted, together with the expected one-to-one line and a best-fit line.
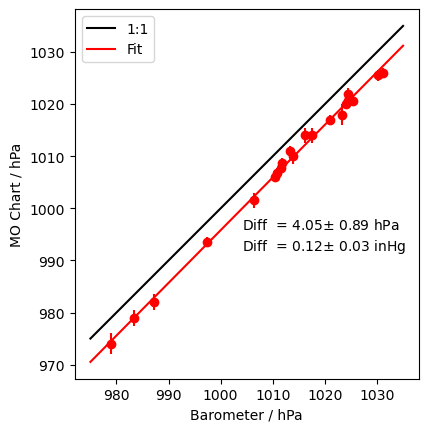
It is clear that the instrument is working. (Or, depending on what you regard as reliable, that the Met Office is doing a good job of forecasting sea-level pressure, 24 hours in advance.) It is also clear that there is an offset of about 4 hPa or 0.12 inHg between the two estimates. This suggests that the adjustment screw at the bottom of the barometer needs a tweak to ensure that it reads sea-level pressure without an offset. The barometer’s location is only about 7m above sea level; it should read about 0.8 hPa lower than the Met Office charts, not 4 hPa higher. I really do not want to touch the screw, however, as I am worried that I may cause a catastrophic mercury leak.
2005 Update
I have continued adding to the data file when I remember, especially when the pressure is unusually high or low. With the greater spread of points it is clear that not only is my barometer reading slightly too high, but there is also a suspicion that the regression line does not have a slope of exactly 1: the bias in my instrument appears to be larger at low pressures.
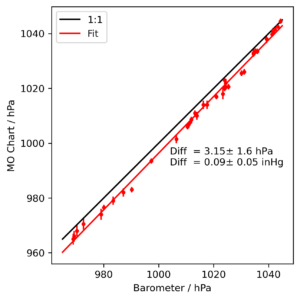
The data points with the very lowest pressures were recorded during Storm Eowyn in January 2005.
Here is the code that produces the plot:
#!/usr/bin/python3

## Code to compare barometer data to Met Office charts

import numpy as np
import matplotlib.pyplot as plt
import os
from scipy import stats

## Read in the data file
dat=np.genfromtxt("baro.dat",dtype="str",skip_header=1)
## Floats have to be converted because file contains a non-numeric column
mopr=np.float64(dat[:,1])
mopr_err=np.float64(dat[:,2])
## Note conversion from inches of mercury to hPa aka  millibars
in2mb=33.8639
baro_pr=np.float64(dat[:,3]) * in2mb

## Time converted into a useable format (although we don't use it)
## We get units of minutes based on the data. It would be preferable
## to be able to force this.
date=np.array(dat[:,0],dtype=np.datetime64)
datestr=np.array(dat[:,0])

plt.ion()
plt.close('all')

### Plot the data points
plt.errorbar(baro_pr,mopr,mopr_err,linestyle="none",
         marker="o",color="red")

plt.xlabel("Barometer / hPa")
plt.ylabel("MO Chart / hPa")
plt.gca().set_aspect("equal")

### Add one-to-one line
pmin=975
pmax=1035
plt.plot([pmin,pmax],[pmin,pmax],"k-",label="1:1")

### Add linear regression line
fit0=1000
fit=stats.linregress(baro_pr-fit0,mopr-fit0)
fitpb=np.linspace(pmin,pmax,10)
fitmo = fit0+fit.intercept + (fitpb-fit0)*fit.slope
plt.plot(fitpb,fitmo,"r-",label="Fit")

plt.legend()


## Calculate mean and standard dev of the difference
## between Met Office and barometer
diffs=baro_pr - mopr

md=np.mean(diffs)
sd=np.std(diffs)

print("Mean diff =",round(md,2),"+-",round(sd,2)," hPa")
print("Mean diff =",round(md/in2mb,3),"+-",round(sd/in2mb,3)," inHg")

## Add stats to figure
plt.text(1004,996,"Diff  = " +str(round(md,2))+"$\pm$ "+str(round(sd,2))+" hPa")
plt.text(1004,992,"Diff  = " +str(round(md/in2mb,2))+"$\pm$ "+
         str(round(sd/in2mb,2))+" inHg")

plt.savefig("baro.png",bbox_inches="tight")

