As noted in a previous post, we had a nice view of the recent eclipse from Edinburgh, and we also took readings of various meteorological variables as part of Reading University’s NEWEX experiment. The plot below shows the temperature data recorded by some keen meteorology students, along with temperatures and solar irradiance data from our rooftop automatic weather station. The vertical lines mark the start, maximum and end of the eclipse.
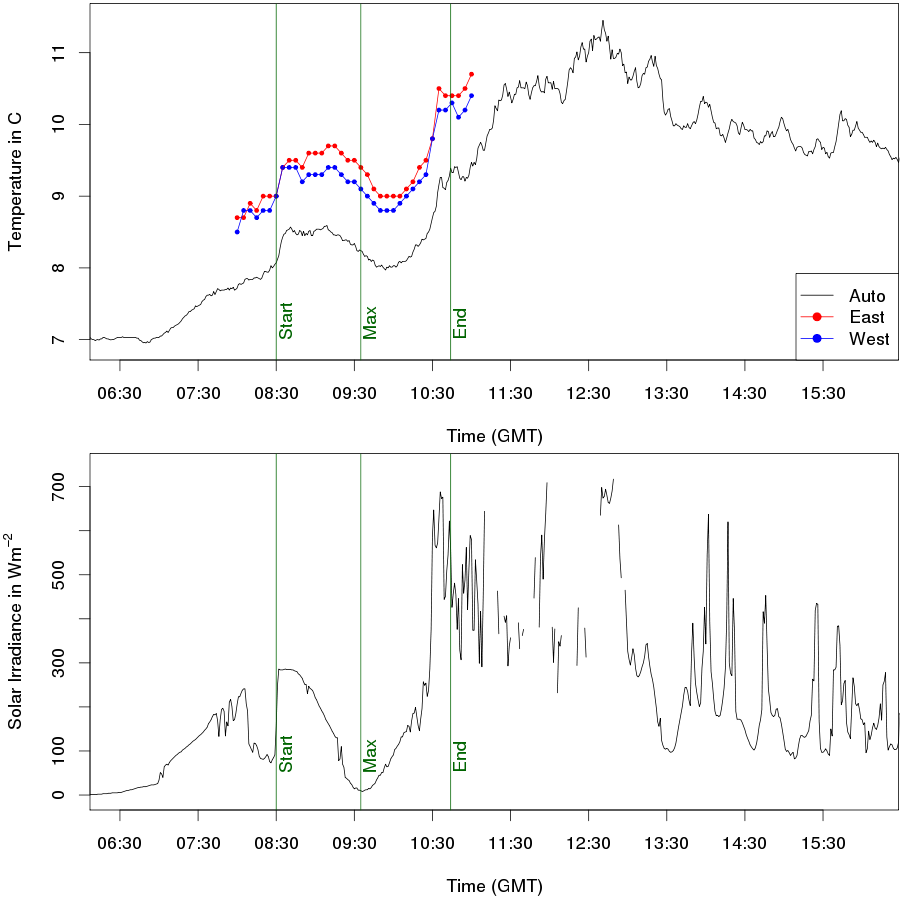
There are two lots of hand-recorded data because we have two Stevenson screens. There is clearly a slight bias between the two screens and a larger bias between them and the automatic weather station (which is one floor higher up). Nevertheless, all three thermometers show a considerable drop in temperature during the eclipse. Many other NEWEX observers saw much the same thing. The temperature minimum occurs about 10 minutes after the irradiance minimum — this may be partly because it was cloudy during the second half of the eclipse period and clear during the first half.
Our wind data were very dull, showing no clear difference between the eclipse period and the time either side of it.

