I am teaching a few lectures of one of our introductory meteorology courses this semester. I have just finished three lectures and a tutorial exercise on fronts (interesting) and airmasses (dull, but you need them to understand fronts).
The Met Office have recently made a new sort of current weather plot available which shows up fronts nicely. These plots are made by Lidar instruments whose main purpose is to measure cloud heights, although they may also detect other particles in the air, such as smoke and volcanic ash. The lidar plots showed up a nice example yesterday as an occluded front passed over the lidar at Camborne in Cornwall:
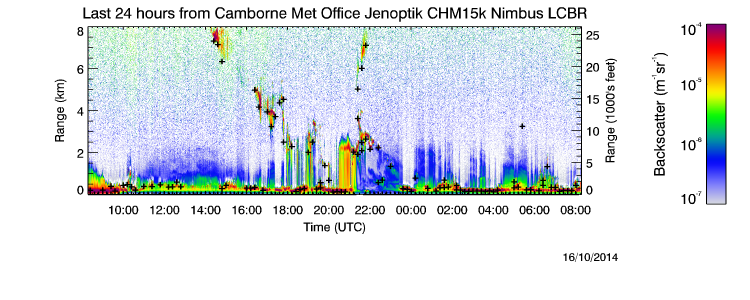
It looks as if the occlusion passed over the station some time between 20:00 and 22:00 UTC. The approaching warm frontal surface can be seen descending from 8km to ground level between 14:30 and 20:00. There is a short period of thick, low cloud between 20:30 and 21.15, after which we catch a glimpse of the cold front surface; it is much steeper than the warm front surface, just as the text books describe it.
The timing of the front’s passage does not quite seem to agree with the position of the occlusion as drawn on the Met Office’s 18:00 analysis chart. 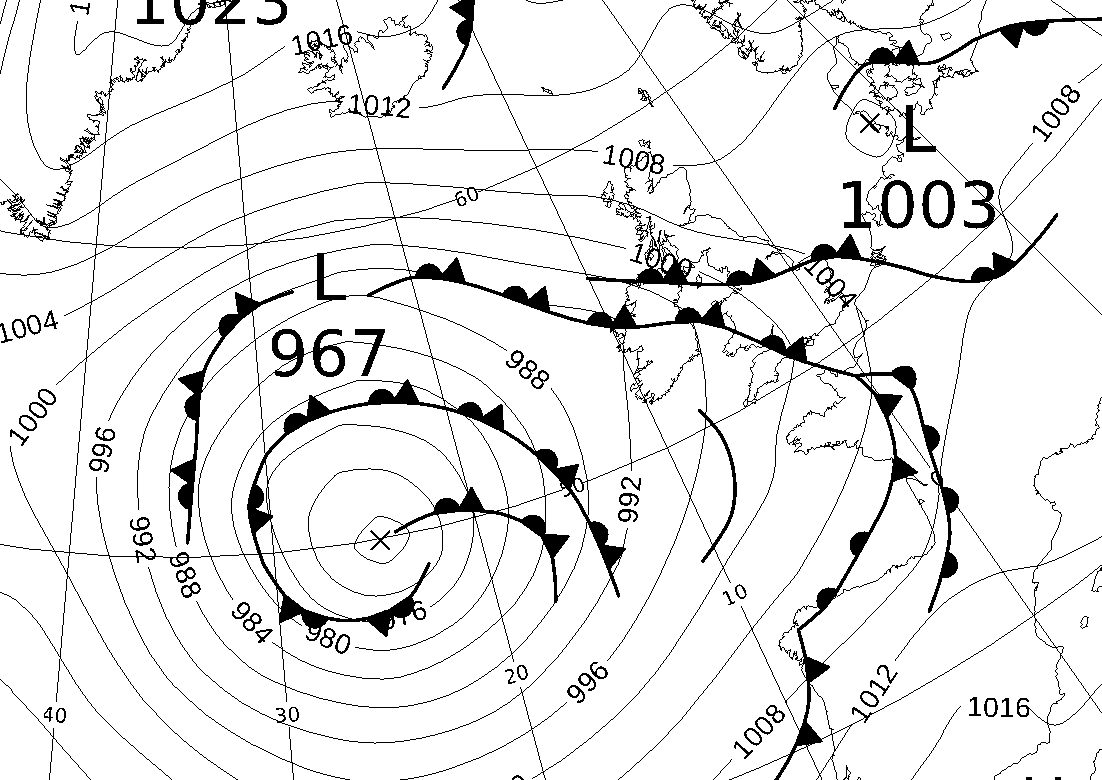 This suggests a passage time somewhat before 18:00. It is worth noting that the big low-pressure area is a complex one with several occlusions and a number of rain bands some of which get “promoted” to being occlusions between one weather chart and the next. I shall keep looking at the lidar plots to see whether we get any nice examples of cold and warm fronts, or other occlusions, over the next month or two.
As an aside, the Wikipedia article on lidar suggests that there is no agreement on how to capitalise the word. So I make no apology for any inconsistency in the way I have capitalised it. Also, the Met Office have a nice fact sheet on airmasses and fronts.

