This is the week which the University of Edinburgh rather grandly titles “Innovative Learning Week”. (I am sorry to report that at least some students and staff refer to it as Innovative Laundry Week. Everyone uses the three-letter-acronym ILW.). Normal teaching stops for a week and a variety of other educational activities are laid on.
As an ILW activity, some of my colleagues laid on a little excursion to the top of Arthur’s seat in order to measure how the pressure varies with height: an experiment first done by Blaise Pascal in 1648 at the Puy-de-Dome in France. The weather was not exactly lovely, but it was far from bad enough to cancel, so off we went.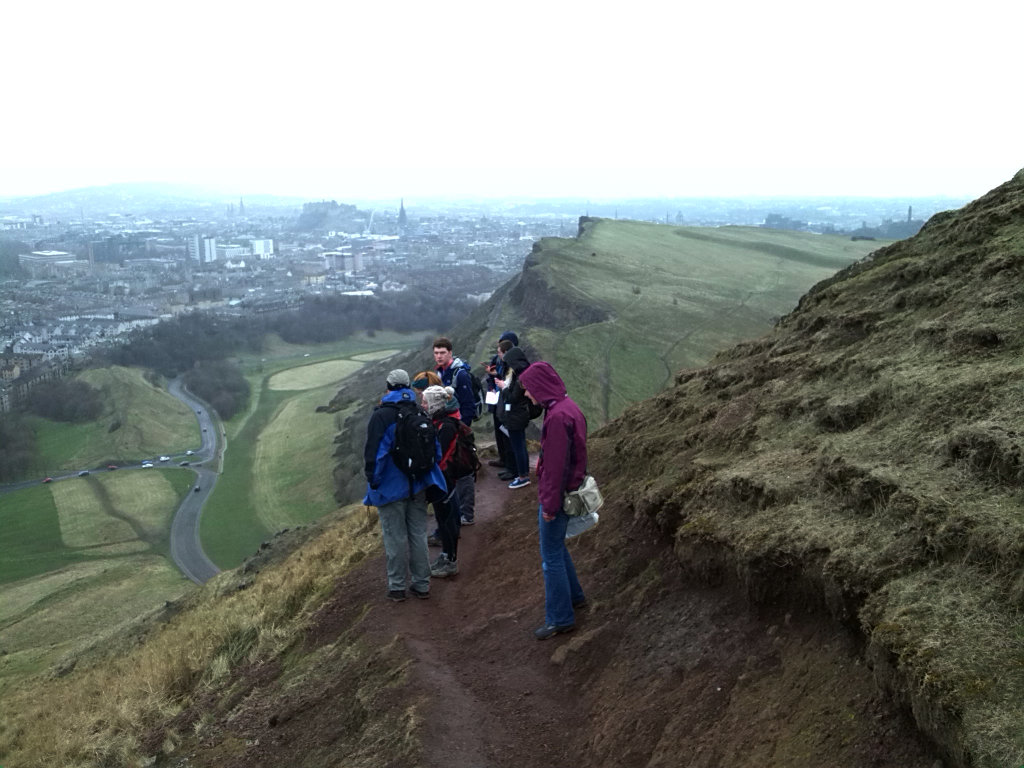
Fortunately, unlike Pascal’s sidekick, we did not have to lug glass tubes and mercury up the hill; we used handheld altimeters (which are really a barometer and will report the true pressure if you press the right button). The GPS in my smartphone was pressed into service (again: see this earlier post); I read the co-ordinates at the points where we stopped to take weather data (big red dots on the map below), but I also left it logging every 10 seconds (small red dots).
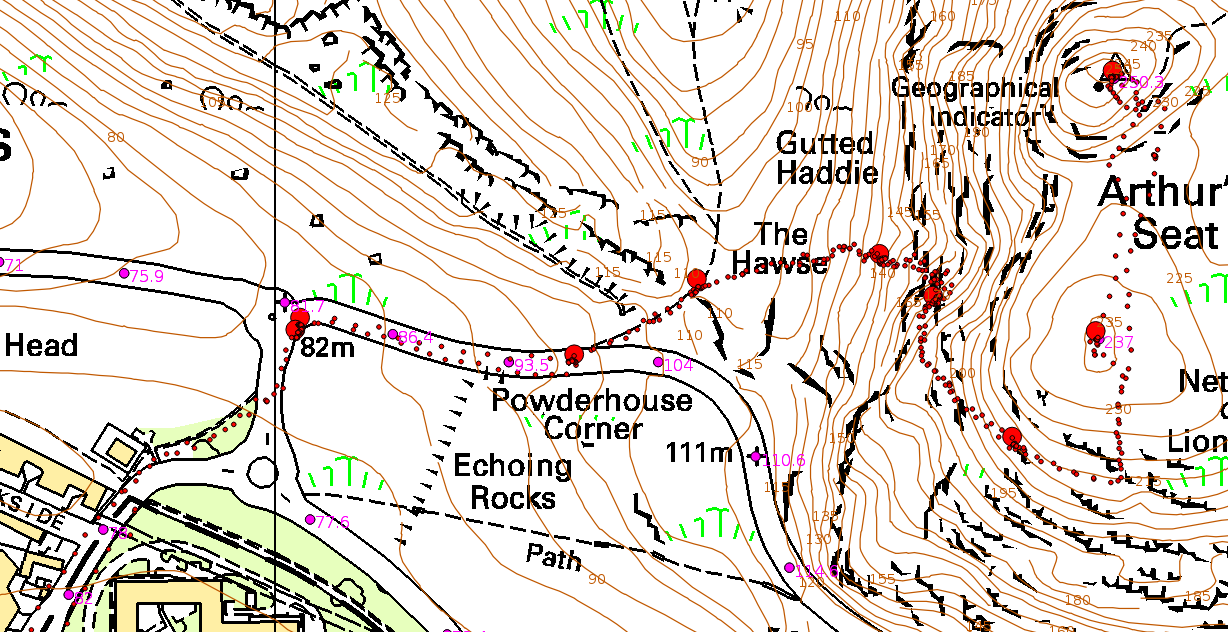
At least some of the eight stations were chosen because they were at surveyed spot heights in the OS dataset. I estimated the heights of the other stations from the contours, so that I had an estimate of the height that didn’t come from the GPS.
If you integrate the hydrostatic equation for a constant temperature, you get this relationship between pressure, p, and height z: log(p/p0) = -(g/RT) (z–z0). Here, p0 and z0 are the pressure and height of the first station, g is gravity, T is temperature and R is the gas constant for dry air (not the universal gas constant). So, if we plot -log(p/p0) against (z–z0), we should get a straight line.
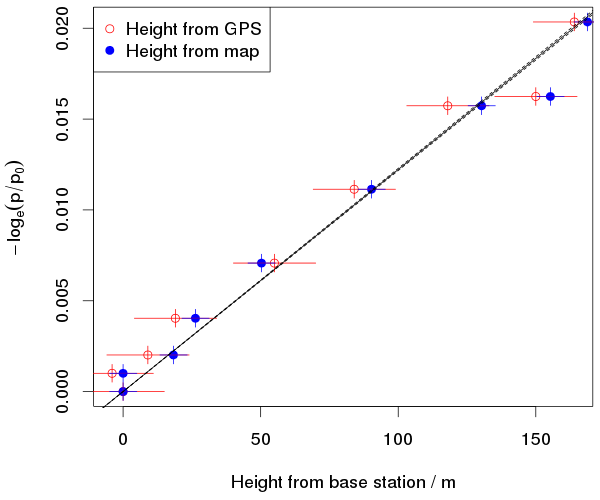
The plot shows the data (using both height estimates) and the theoretical line. I actually plotted three lines, using the warmest and coldest temperatures we measured, but the temperature doesn’t make much difference over this small altitude range. I guessed 15m as the error for the GPS heights. The instrument usually claims 5m error when in the open, with a good sky view. But it is talking about the error in the horizontal position: the error in the height is at least twice as large. I am boldly claiming to estimate the height to within 5m from my horizontal position and the contours on the map. The error in pressure is assumed to be only due to the fact that the altimeters only report pressure to the nearest whole hPa, so it could be wrong by about half a hPa. This is probably rather optimistic. We had a bagful of these instruments and they were not in perfect agreement with each other.
We recorded the temperature, wind speed and humidity as well as the pressure. Here is a plot of the vertical temperature profile:
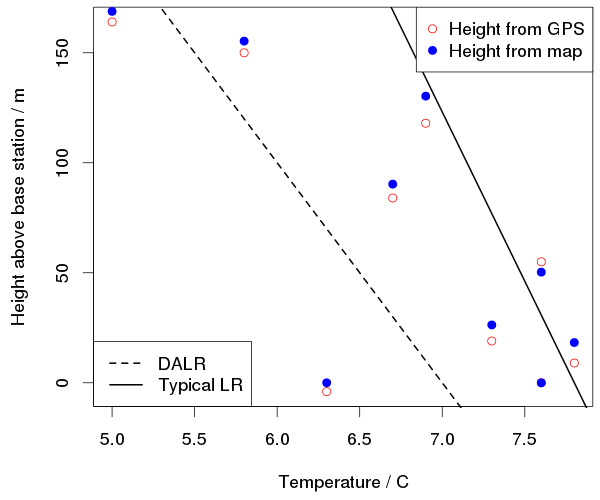
The decrease of temperature with height must be less than the dry adiabatic lapse rate of about 10°C/km and is on average about 6°C/km. It was a bit colder at the top of the hill, but it was also getting colder overall as we went up; that one point at height zero and 6.3°C is from when we got back down to the first station.
It was an interesting afternoon out, certainly a lot better than sitting at my desk. It would be nice at some point to do it on a bigger hill, maybe with a cleverer way of measuring height and pressure. Differential GPS or traditional surveying gear would do for the height, and we could use our WWII-vintage precision aneroid for pressure — it is precise to at least 1/10 hPa. (It is, however, the size of two bricks; the handheld altimeters are the size of a pocket watch.) It would be nice to make the exercise part of an extended period of meteorology field work. It is hard to justify trips for meteorology, though. If you want to see some Jurassic strata, you have to go where they are. But if you want to study some weather, you can stay in Edinburgh and quite a lot of it will come to you.


4 Replies to “Meteorology field trip: Arthur’s seat”