From our local volcano, which last erupted some 350 million years ago, to one the other side of the world which erupted last week. Kelut, in Java (Indonesia) erupted late on 13 February, causing considerable ash fall and other damage and destruction. I am interested in volcanoes because I am trying (and, so far, failing) to complete a paper on the measurement of SO2 by the MLS instrument. MLS measures about 14 chemical species in the stratosphere and mesosphere and nearly 500 papers have been written using data from the instrument in the ten years since it was launched. But none of those papers have used the SO2 data, so I am writing up a first description of it.
There is always a bit of SO2 in the stratosphere, but most of the time there is not enough for MLS to detect it. A volcanic eruption can change that, if it is big enough. MLS makes measurements at 3495 locations spread all round the world every day. If we count how many of those locations on each day have clear detections of volcanic SO2, we get a picture like this:
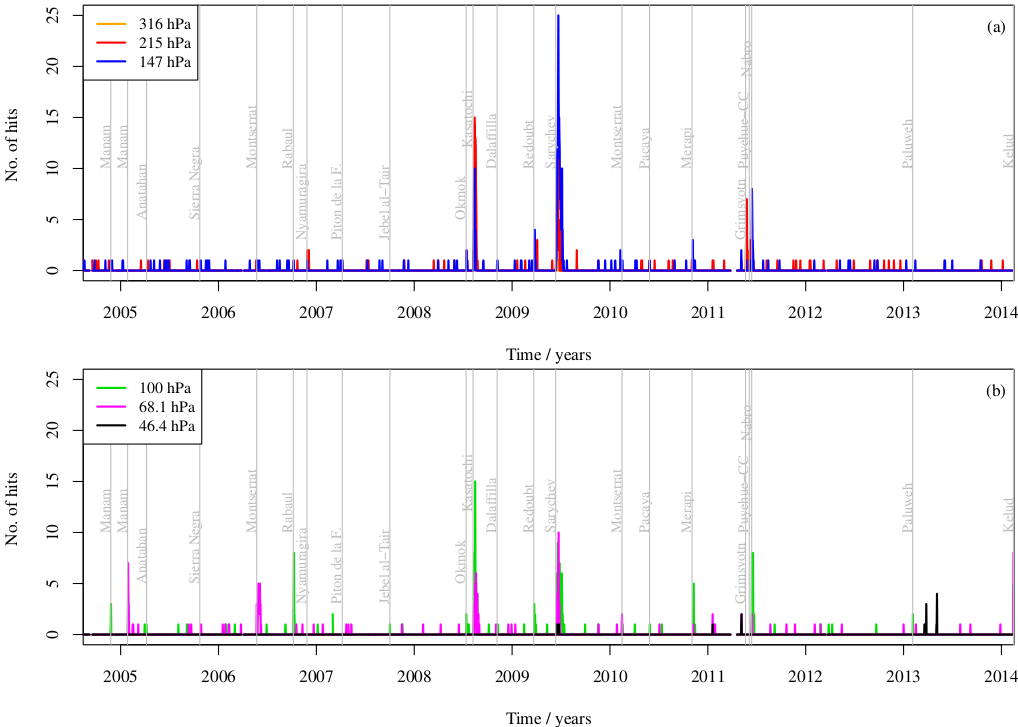
Most days, there are no detections or “hits”, or there is one false alarm. Much more than that means that we have seen a volcano. The largest volcano we have seen so far was Sarychev (in the Russian Kuril islands) in 2009. If we expand the plot to show just the last few days, it looks like this:
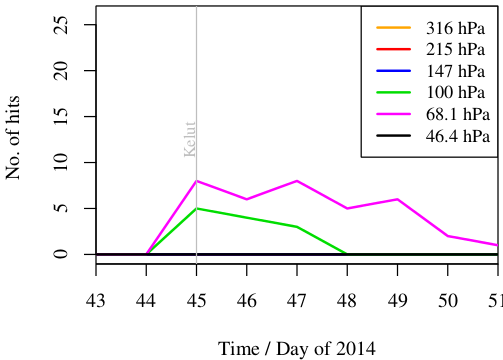
Clearly, the Kelut eruption is nothing like as large an event as was Sarychev in 2009. (It has caused much more trouble, though: nobody lives in the Kuril islands.) All of the SO2 observed is at the 100 hPa and 68 hPa levels (about 16 km and 18.5km in altitude). It looks as if the SO2 is dispersing now and as if MLS is losing sight of it. I have set up an automatically-updating version of the plot, so you can keep an eye on it yourself. (This version uses a less stringent detection criterion, so you can spot smaller events at the price of getting more false positives.)
If we make a map showing the places where we measure enhanced SO2 it looks like this:

The points are coloured according to time, so the blue ones are just after the eruption, the pink ones the most recent. The cloud of SO2 appears to have been stretched out westwards, with the eastern end of it staying above Java. In the last day or two, it has moved northwards a little. There is an automatically-updating version of this plot as well. Again, it has a looser detection criterion, so there are more false positives as well as more real detections.


3 Replies to “Observation of sulphur dioxide from the Kelut eruption”