Friends down in Yorkshire drew my attention to a serious fire as reported by the BBC. It looks rather dramatic, but I was surprised by the assertion that the plume was “so huge it could be seen from space”. 
Eyeballing the satellite image against a map, the plume seems to be 50 or 60 kilometres long; if you can’t see that from low-Earth orbit (typically 300-800km up), you are not trying very hard. People have some odd ideas about what can be seen from space, but really, what you can see depends mostly on what you are looking at it with. The image in the BBC article was clearly produced by NASA. I’m pretty sure it was taken by the MODIS instrument; in fact, I think it was taken around mid-day on 16 Jan by the MODIS instrument on the Terra satellite. The NERC satellite station has a quicklook of the image here. (You will have to register before the link will work.) MODIS is not a high-resolution instrument: the pixels are 1/4 or 1/2 km across for the visible light channels. So you can’t see your house with it, but it is entirely unsurprising that you can see a 50km smoke plume. Although MODIS doesn’t produce very high resolution images it is the highest-resolution instrument to cover (almost) the entire world every day.
You can get higher-resolution images from the new Landsat 8 satellite, which I have mentioned in this blog before. With pixels 30m across, you can see detail almost down to the size of your house (but not your car). Nowadays, you can get Landsat images for free, and rather quickly after the instrument recorded them. The ESA Landsat 8 portal is a convenient place to get the images of Europe; it also makes it clear that getting an image of a transient phenomenon such as a fire with Landsat is largely a matter of luck. Do a search for a particular day and you might find a line of images covering the UK, but the next line along probably runs from Greece to Finland. The gap in between takes eight days to fill up and the whole pattern only repeats every 16 days.
The Sherburn fire, as it happens, was at just the right time to be observed by LandSat 8.
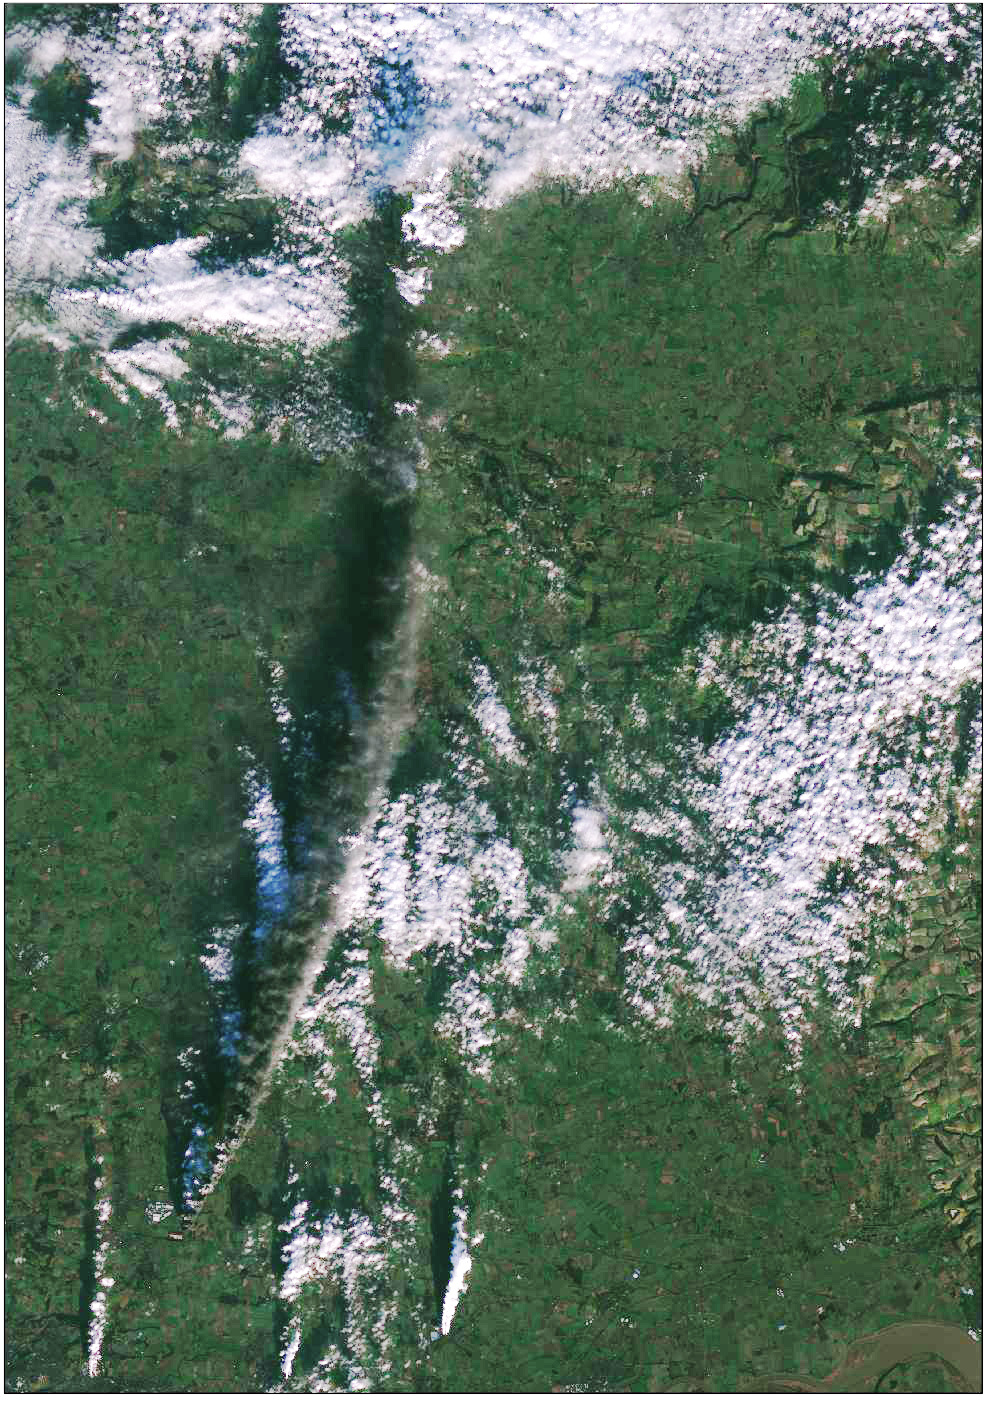
This is clearly a more detailed picture than the MODIS image, but it doesn’t show the full 30m detail; I have thrown some detail away to ensure that this web page isn’t too slow to load. It is still very much more detailed than the MODIS image. But it is nothing like the most detail you can see from space. The commercial SPOT satellites have 5m pixels and there are other commercial satellites which have better resolution still. And who knows what the secret military spy satellites can see? Landsat images are, nevertheless, probably the most detailed satellite imagery that you can obtain for free.
In addition to the plume from the fire, the image shows three plumes from the three large coal-fired power stations at, from West to East, Ferrybridge, Eggborough and Drax. (Although LandSat does not travel exactly South to North, the image is registered to a UTM grid, so North is upwards.) The interesting thing about the plumes is that the smoke from the fire is travelling in a different direction to the three power-station plumes. Presumably, there is some vertical wind shear, by which I mean that the wind at different heights is travelling in different directions (or at different speeds). As this semester’s meteorology class will be finding out, there are two main causes of vertical wind shear: friction in the boundary layer, and the thermal wind. To understand what is going on in this case we have to try to estimate whether the fire smoke is higher or lower than the power station plume. I can’t turn up a photo of the area take from the ground and from a sufficient distance, so there is a bit of guesswork involved here. The power station chimneys are about 200 or 250m tall, with the cooling towers being lower. One of the pictures in the BBC article has one of the power stations in the background and it appears that the power station plume is travelling almost horizontally, not rising to much more than two chimney heights. Is the fire smoke higher? It is a bit hard to tell from the image because, although the shadows of the plumes can be seen, the sun is shining almost along the length of the plumes. Nevertheless, my impression from the shadows is that the fire smoke is considerably higher up than the power station plumes. Presumably, the smoke is hotter than the power station fumes, so convection takes it to a greater height. I plotted up a weather chart to see what was going on.
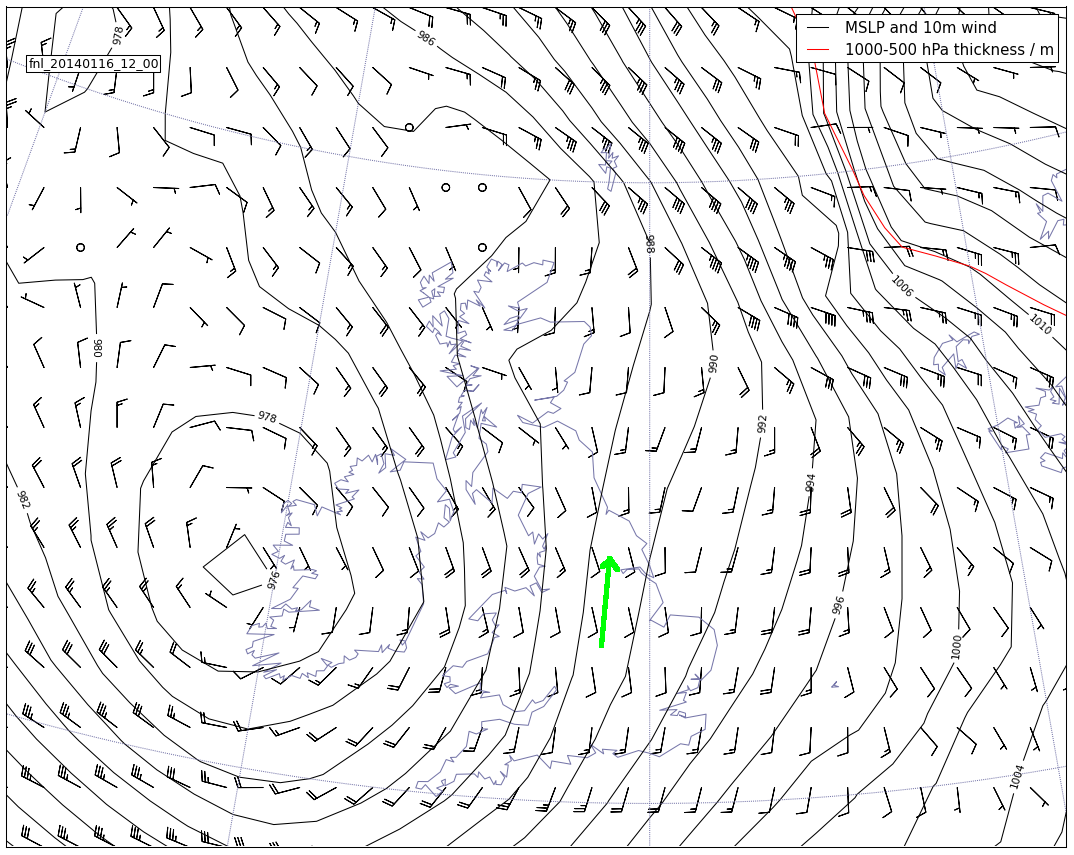
(I used python / matplotlib again as per this earlier post.) The big green arrow marks where the fire is. The little feathers are the wind at the standard height of 10m; surface friction causes the wind to blow across the isobars towards the low pressure. If friction were negligible (and it becomes quickly less important as you go away from the ground) the wind would be geostrophic and would blow along the isobars. So it looks as if the wind near the surface should blow from slightly East of South (towards slightly West of North), while the winds a bit higher up should blow from slightly west of South (towards slightly East of North). That fits nicely with what the plumes are doing. None of them are low enough to be in the direction of the 10m wind. The power-station plumes are higher than 10m, so they are rotated a bit clockwise, but the smoke is higher still and is travelling in more or less the geostrophic direction. (The geostrophic wind direction itself changes as you go up, that’s what I meant by the “thermal wind”. But in this case it doesn’t change much in the first 1.5km, so I think the different directions we are seeing are all to do with friction.)

