As a background hobby activity over the summer I have been setting up one of our Lacoste-Romberg gravity meters so that I can show a continuous recording of its output on a web page.
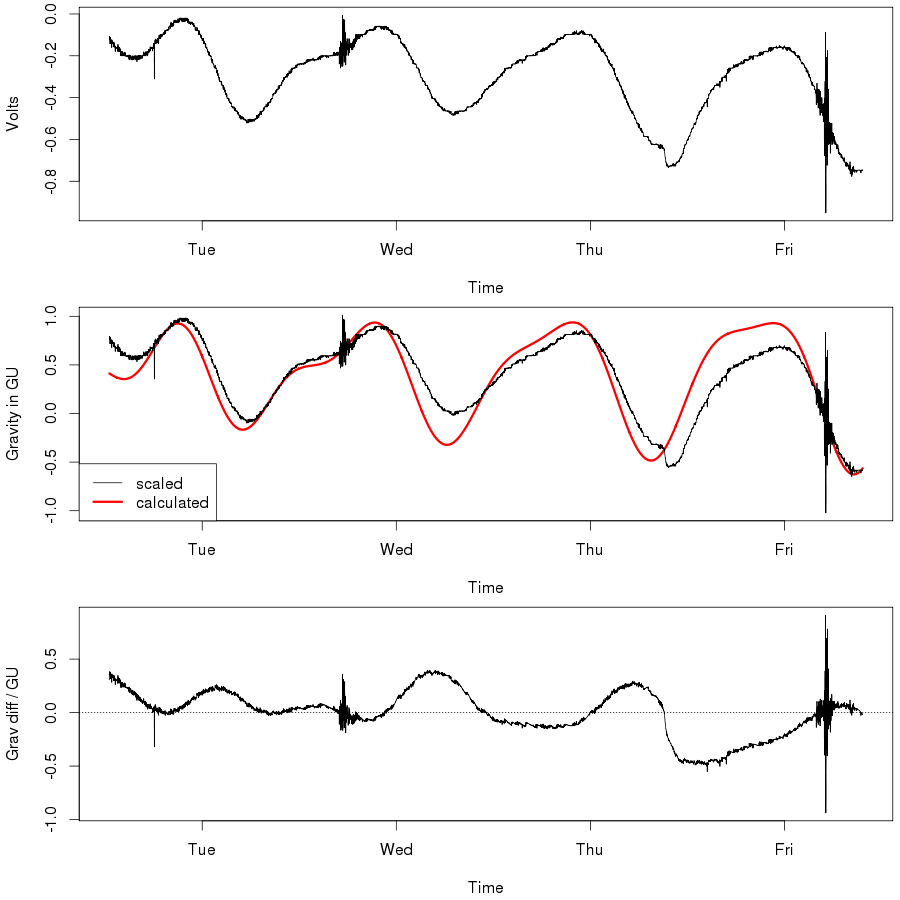
The picture shows the first few days of data; if the system is still working then the up-to-date plot is here. In addition to the gravity tides (which sort of agree with the red theoretical curve) the plot shows two earthquakes. Today’s (Friday’s) was in New Zealand; Tuesday’s was in Colombia.
As usual with things involving actual equipment, it all proved to be more complicated to set up than I would have expected. The gravity meter produces a voltage output; the same signal that goes to its beam position galvanometer. I therefore needed a data logging device: The DATAQ DI-145 looked rugged and simple so I got one of those. Learning to get the data out of it onto a computer running Linux was simple. Understanding why it worked on some computers and not others involved the acquisition of some rather arcane knowledge involving serial port settings and the stty command.
Once I had the data flowing, I then wanted to plot the theoretical tide for comparison. That, too, turned into a bit of a time sink. One of the ways to do the calculation is detailed in Longman (1959); the paper provides all the formulas you need. And there are rather a lot of them. I looked for extant code on the web and found the following:
- A web form that applies Longman’s formulas
- A BASIC (yuk!) program that does likewise
- A C program that purports to do likewise but which seems to get the wrong answer
- A very sophisticated Windows program, which is not easy to call from a script on a Linux machine
As none of these were what I wanted, I took a deep breath and re-coded the Longman formulas in the very wonderful R, as that is what I used for the rest of the data processing and plotting. Tracking down the last major bug in my code took ages. I was reduced to translating the BASIC program into R as a cross-check. When that worked, I knew that my own code must have a simple bug; Murphy’s law ensured that it was in almost the last line of the function. It does now seem to be working but it needs a bit of tidying up before I post it on the web. And I am also itching to annotate the plot with earthquake reports from the USGS.


I have improved the live plots a little. The fit is now better and I have added markers for earthquakes of about the size that the instrument can detect.