Any views expressed within media held on this service are those of the contributors, should not be taken as approved or endorsed by the University, and do not necessarily reflect the views of the University in respect of any particular issue.
Here is a process that I have used to generate transcripts for research interviews using locally-installed AI tools. This avoids any concerns about uploading potentially sensitive research data to systems that you don’t control.
I’ve found the quality of these transcripts to be pretty good – there are definitely still some small mistakes, but those are quick to correct on a first pass through the data. It’s also worth noting that the Whisper AI has been trained to eliminate hesitations, so something like “I used, um… I used AI” might just become “I used AI” in the transcript. It also does not identify multiple speakers (e.g., interviewer and interviewee) so that needs to be done separately – again, I’ve found that quick to do on a first pass through the data.
4. Choose the model – I recommend “medium.en” for a balance of quality and speed (you will need to download it the first time you use it)
5. Click the “Generate” button to start the transcription.
You get a progress bar, but it is not very informative!. In practice, I have found that when using medium.en, the transcription process takes about the same duration as the recording.
The transcript will be saves as an .srt file alongside the recording.
To tidy up the output:
1. Open the .srt file in Subtitle Edit.
2. Remove the line breaks:
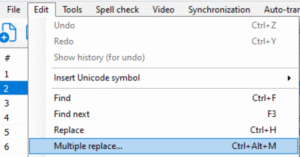
(a) click on “Edit > Multiple replace…”
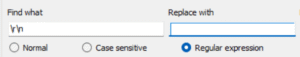
(b) put a space in the “Replace with” field and “\r\n” in the “Find what” field, to find all line breaks and replace them with nothing:
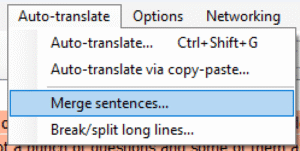
3. Use “Auto-translate > Merge sentences…” to combine any sentences that have been split across multiple lines into a single line:
4. Save the file as a spreadsheet: “File > Save As > csv2” (I’ve not experimented with all of the different output formats, but I’ve found csv2 works quite well).
When students answer STACK questions, the Moodle quiz system stores lots of information about their work. How can we get access to the data to learn from it?
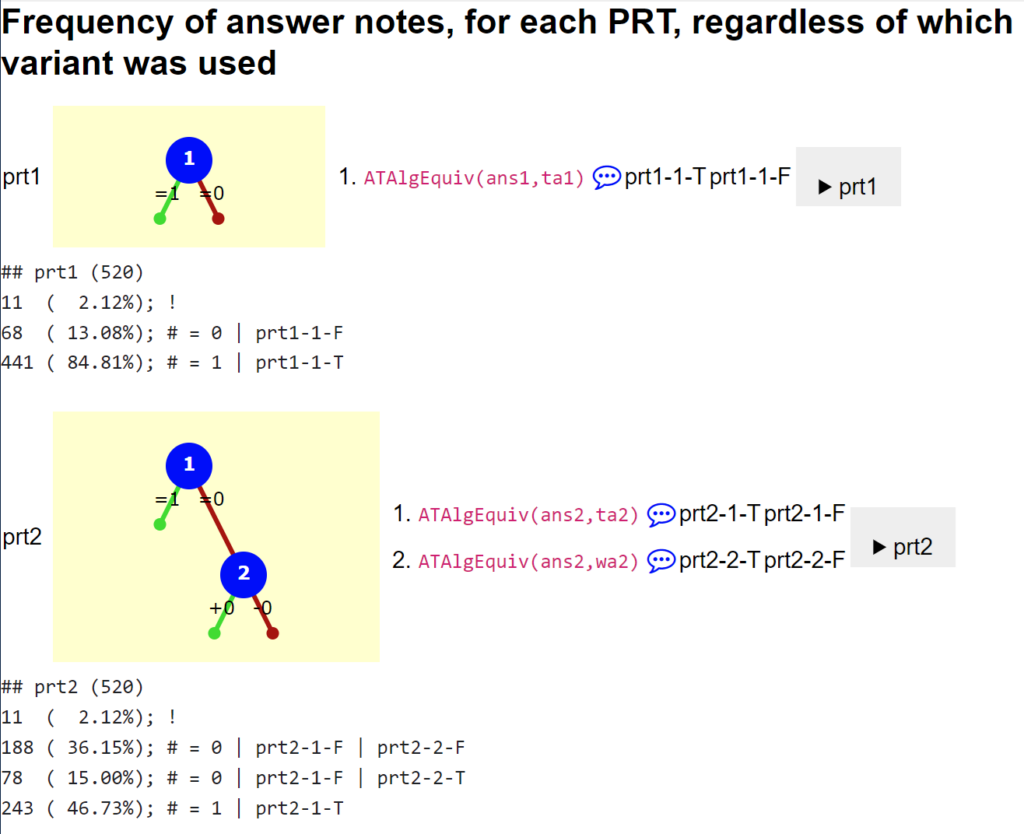
The STACK plugin provides an overview of how students responded to the question. In particular, this shows
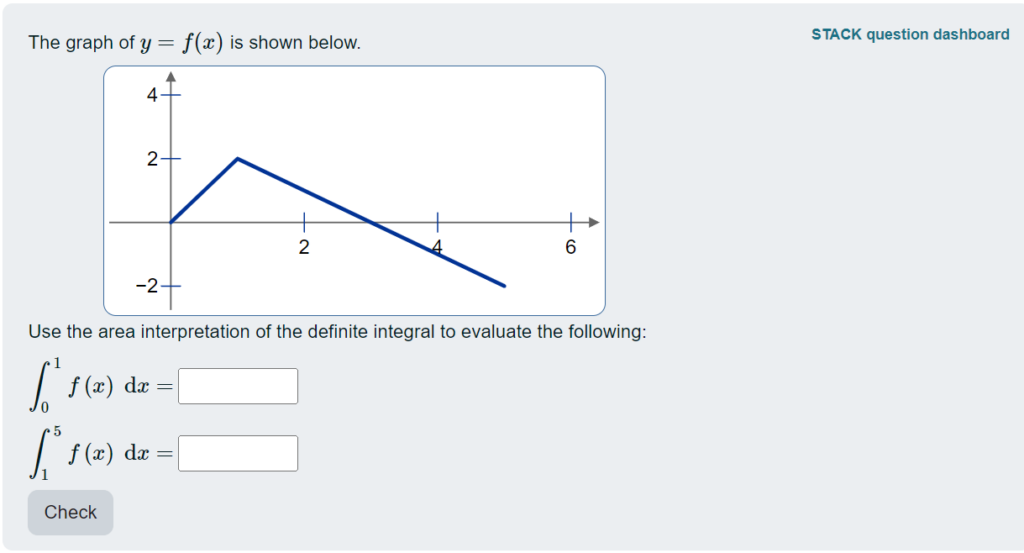
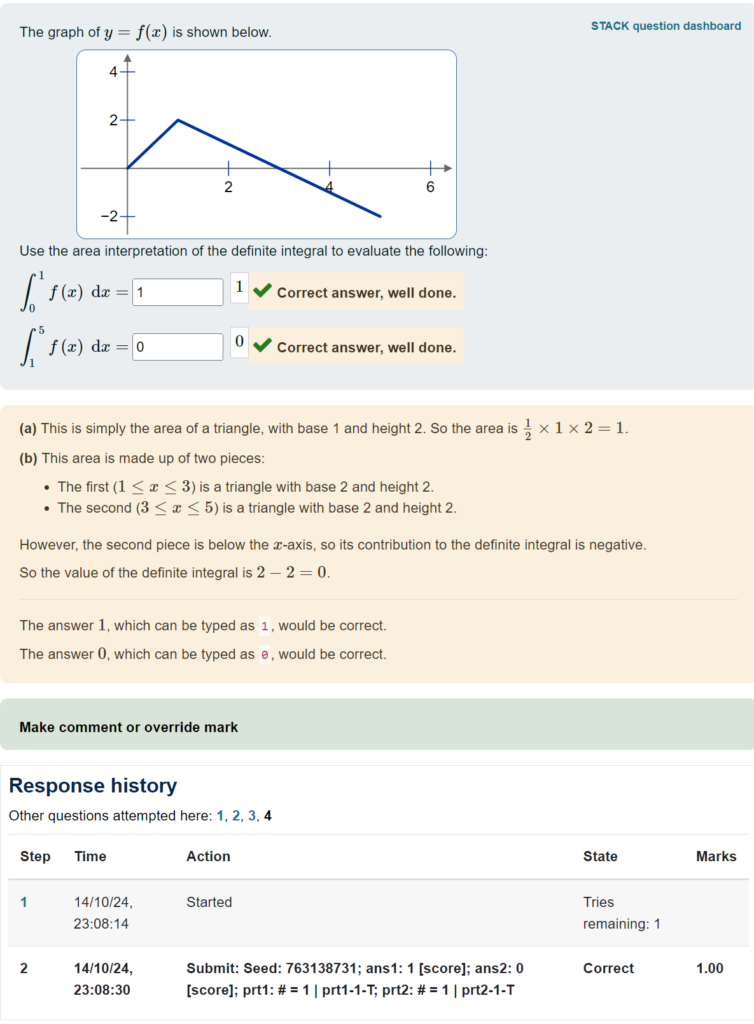
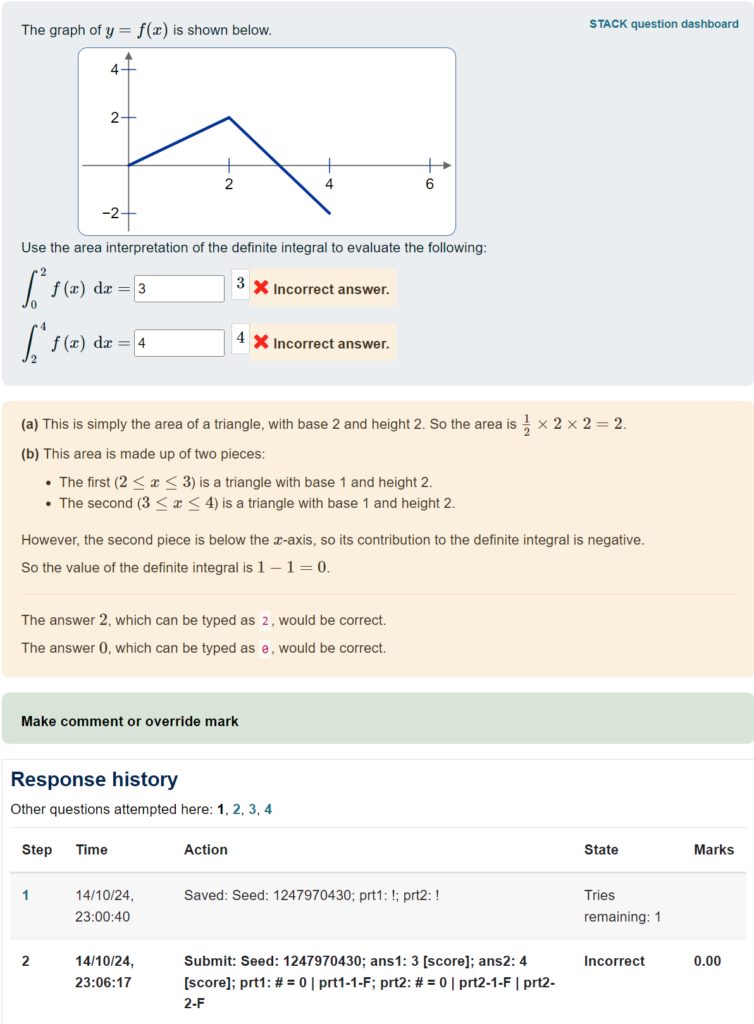
To get access to this report, as a teacher, click on the “STACK question dashboard” link at the top-right of the question:
Then select the “Analyze responses” option from the top menu bar:
I find the first section of the response analysis page quite helpful to get an overview of how frequently students ended up at different parts of the potential response tree:
For instance, this shows that in prt2, 78 responses (which was 15% of the total) ended up at prt2-2-T, which was a node that I included to check for a specific error and to give feedback accordingly.
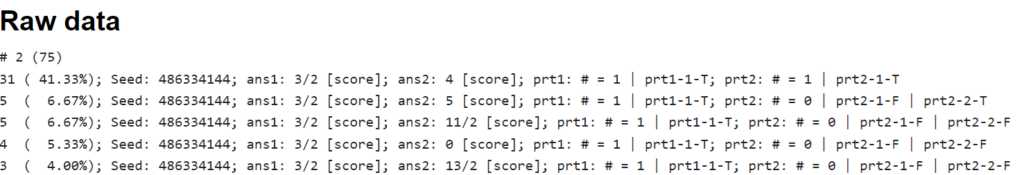
You can also see the raw data at the end of the page:
This packs in quite a lot of information! This example shows that variant number 2 was answered 75 times, and then we see the different responses ordered from most to least common – in particular, 31 of the responses were the correct answer (3/2 for ans1 and 4 for ans2 for this variant of the question).
I find it useful to use the browser’s “find text in page” search function, to look for instances of a particular PRT node that I’m interested in. If you want to do a more methodical analysis, you might want to copy/paste this data into a text file and do some processing offline.
It’s also worth checking in case there are particularly common incorrect responses that you hadn’t anticipated. Of course, it can be tricky to figure out from the final answers alone what error the students might have made! But if you can, then you may want to add a node to your PRT that gives feedback on this error. This paper gives a nice example of the process of updating a PRT based on the response data:
Alarfaj, M., & Sangwin, C. (2022). Updating STACK Potential Response Trees Based on Separated Concerns. International Journal of Emerging Technologies in Learning (iJET), 17(23), Article 23. https://doi.org/10.3991/ijet.v17i23.35929
Quiz results report
If the question attempts took place in a quiz, you can also see data about them from the quiz results report.
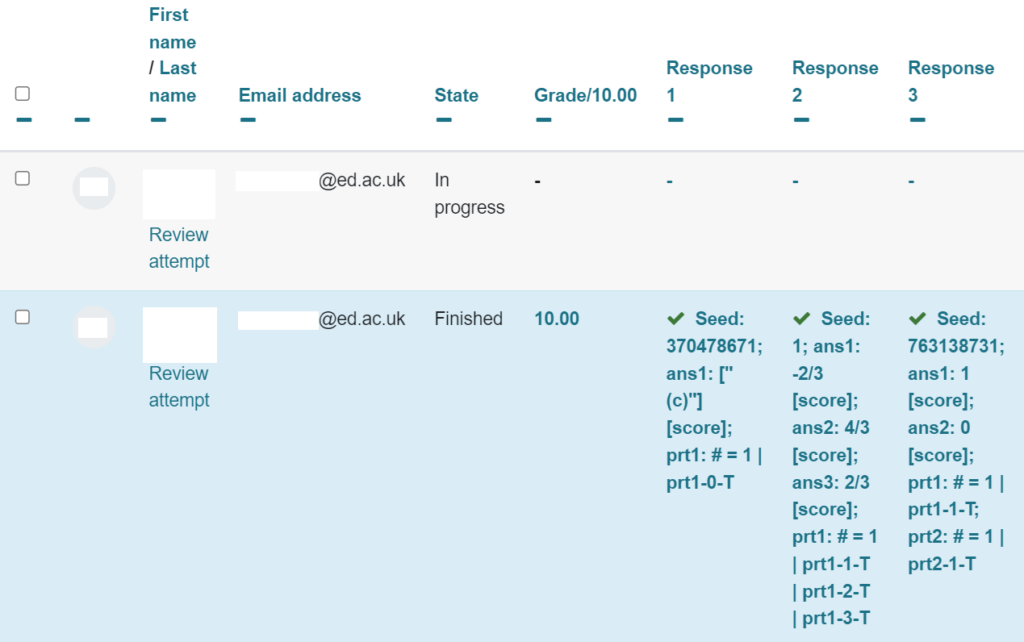
To see this, go to the quiz, then choose the Results tab. You’ll see a table with a row for each student, and a column for each question on the quiz. In the default “Grades” report, the entries in the table are the grades. You can also switch to the “Results” report (using the dropdown list just below the “Quiz / Settings / Questions / Results” tabs), and the entries in the table will show you the same sort of text as in the “raw data” shown above.
Here’s an example of what it looks like, where “Response 3” shows the same question as above:
You can download a spreadsheet of all this data for offline work. However, it’s important to note that this table only shows the student’s last attempt at the question.
You can also click on an individual entry, to see a preview of the question.
You can see at the bottom of the preview the same response summary, along with the time when the student submitted the answer.
Importantly, this quiz used “interactive mode”, so students were able to “try another question like this”. You can see at the bottom there are links “1, 2, 3, 4” to the different attempts. Here is what the student’s first attempt looked like:
This lets you drill down to see how individual students worked through the questions. But it’s a very manual process…
Database query
It’s helpful to be able to be able to get access to all of the response data at once – particularly for research purposes. I first did this in a study involving hundreds of students, so it was important to be able to get all the data in an efficient way!
Since I had Moodle Administrator access, I was able to use the “Ad-hoc database queries” plugin. (If you want to use the plugin, you’ll either need Administrator access, or ask your administrator to install it and give you access to it.)
I put together an SQL query to extract all student attempts at questions in a given quiz:
When you run the query using the ad-hoc database queries plugin, you are prompted to enter the quiz id. The plugin then produces a report that you can download as a spreadsheet. Here is an excerpt of a few of the relevant columns, showing all four attempts by the student from the example above:
Many conferences provide a Word template that must be used for papers (e.g., FAME), and these templates use Word’s styles features to provide consistent formatting. I use Zotero to maintain my reference database, and Zotero’s Word plugin to insert references and automatically generate the reference list. However the reference list formatting ends up being incorrect!
Zotero inserts the reference list and styles it with the “Bibliography” style (which has double-line spacing), while the template uses the “References” style (which is more compact). If you manually apply the “References” style, it will get undone when Zotero refreshes the reference list.
Here is how I’ve fixed the reference list formatting, by modifying the styles.
Put the cursor on the first item in the reference list, and select the “References” style. That will apply the proper style to the first item.
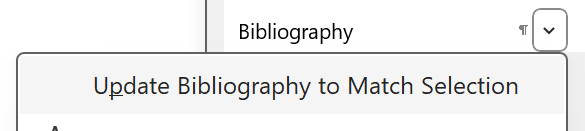
Now click on the dropdown next to the “Bibliography” style, and select “Update Biblography to Match Selection”:
That will change Zotero’s “Bibliography” style to match the correct style in the template. Importantly, that will make the reference list take up the correct amount of space, so you know how close you are to the page limit!
I often work with student data for research purposes, and one of the first steps I take before doing any analyses is to remove identifying details.
Our students have a “University User Name” (UUN) which is an S followed by a 7-digit number (e.g. “S1234567”), which can be used to link different datasets together. I need to replace these identifiers with new IDs, so that the resulting datasets have no personal identifiers in them.
I’ve written a simple R script that can read in multiple .csv files, and replace the identifiers in a consistent way. It also produces a lookup table so that I can de-anonymise the data if needed. But the main thing is that it produces new versions of all the .csv files with all personal identifiers removed!
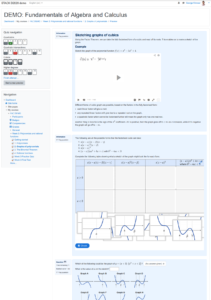
In my online course Fundamentals of Algebra and Calculus, there were several places where I wanted to encourage students to engage with a key proof while reading the text.
One approach to this is to ask proof comprehension questions after giving the proof, but I’ve also tried writing some sequences of questions that lead the students through the proof in a scaffolded/structured way.
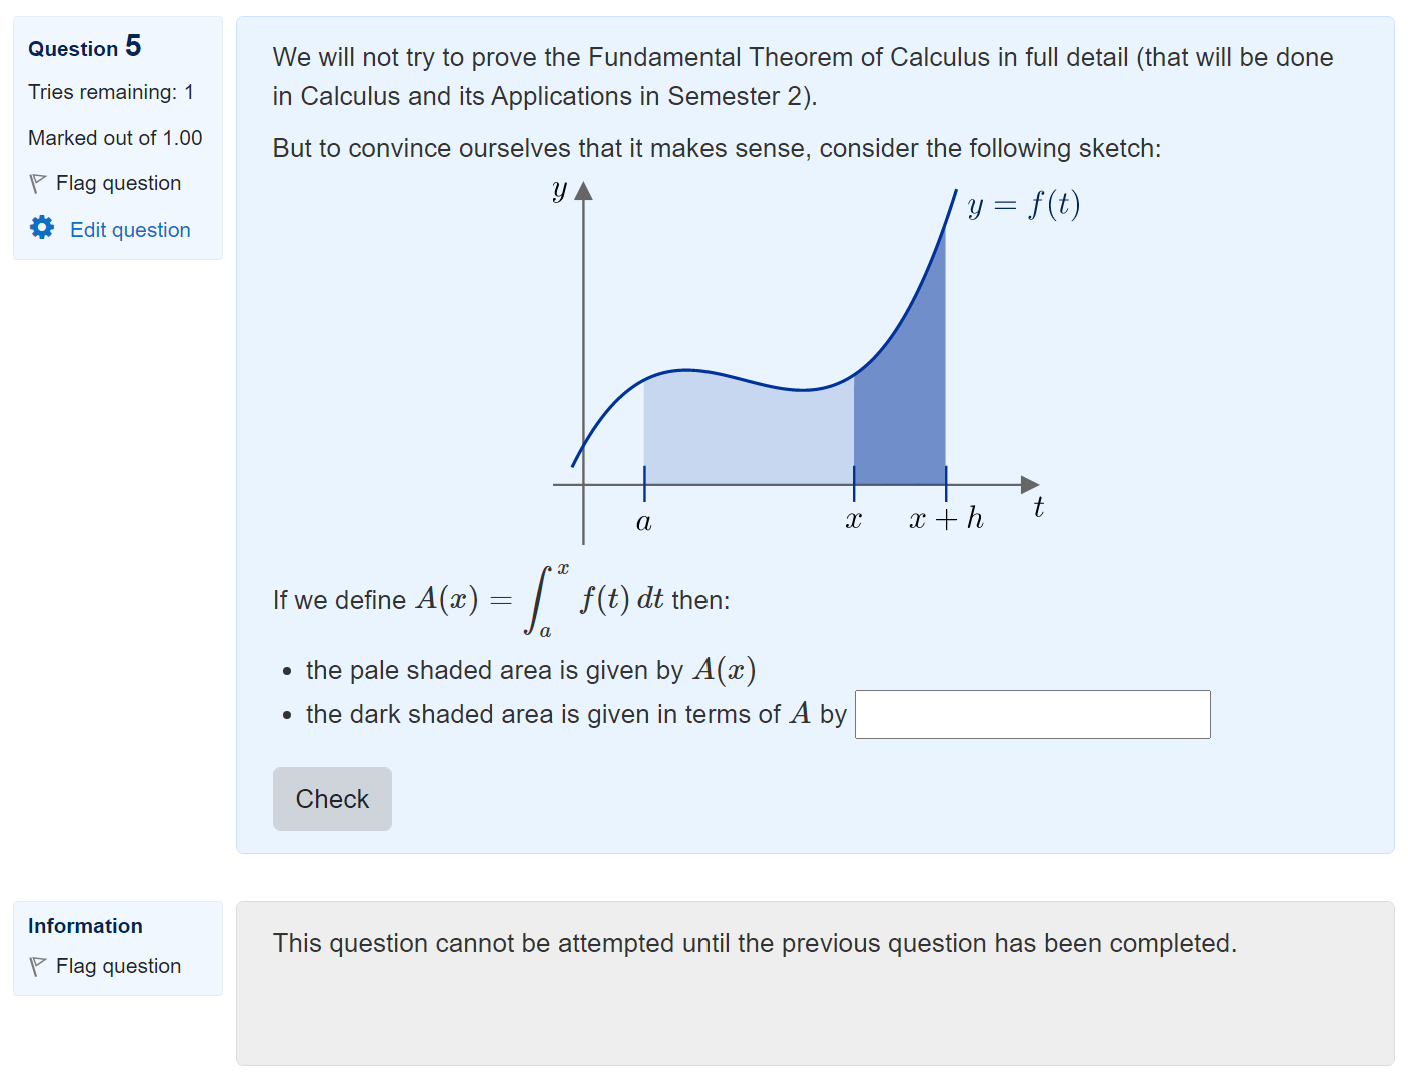
Here’s a simple example, of a sketch proof of the Fundamental Theorem of Calculus:
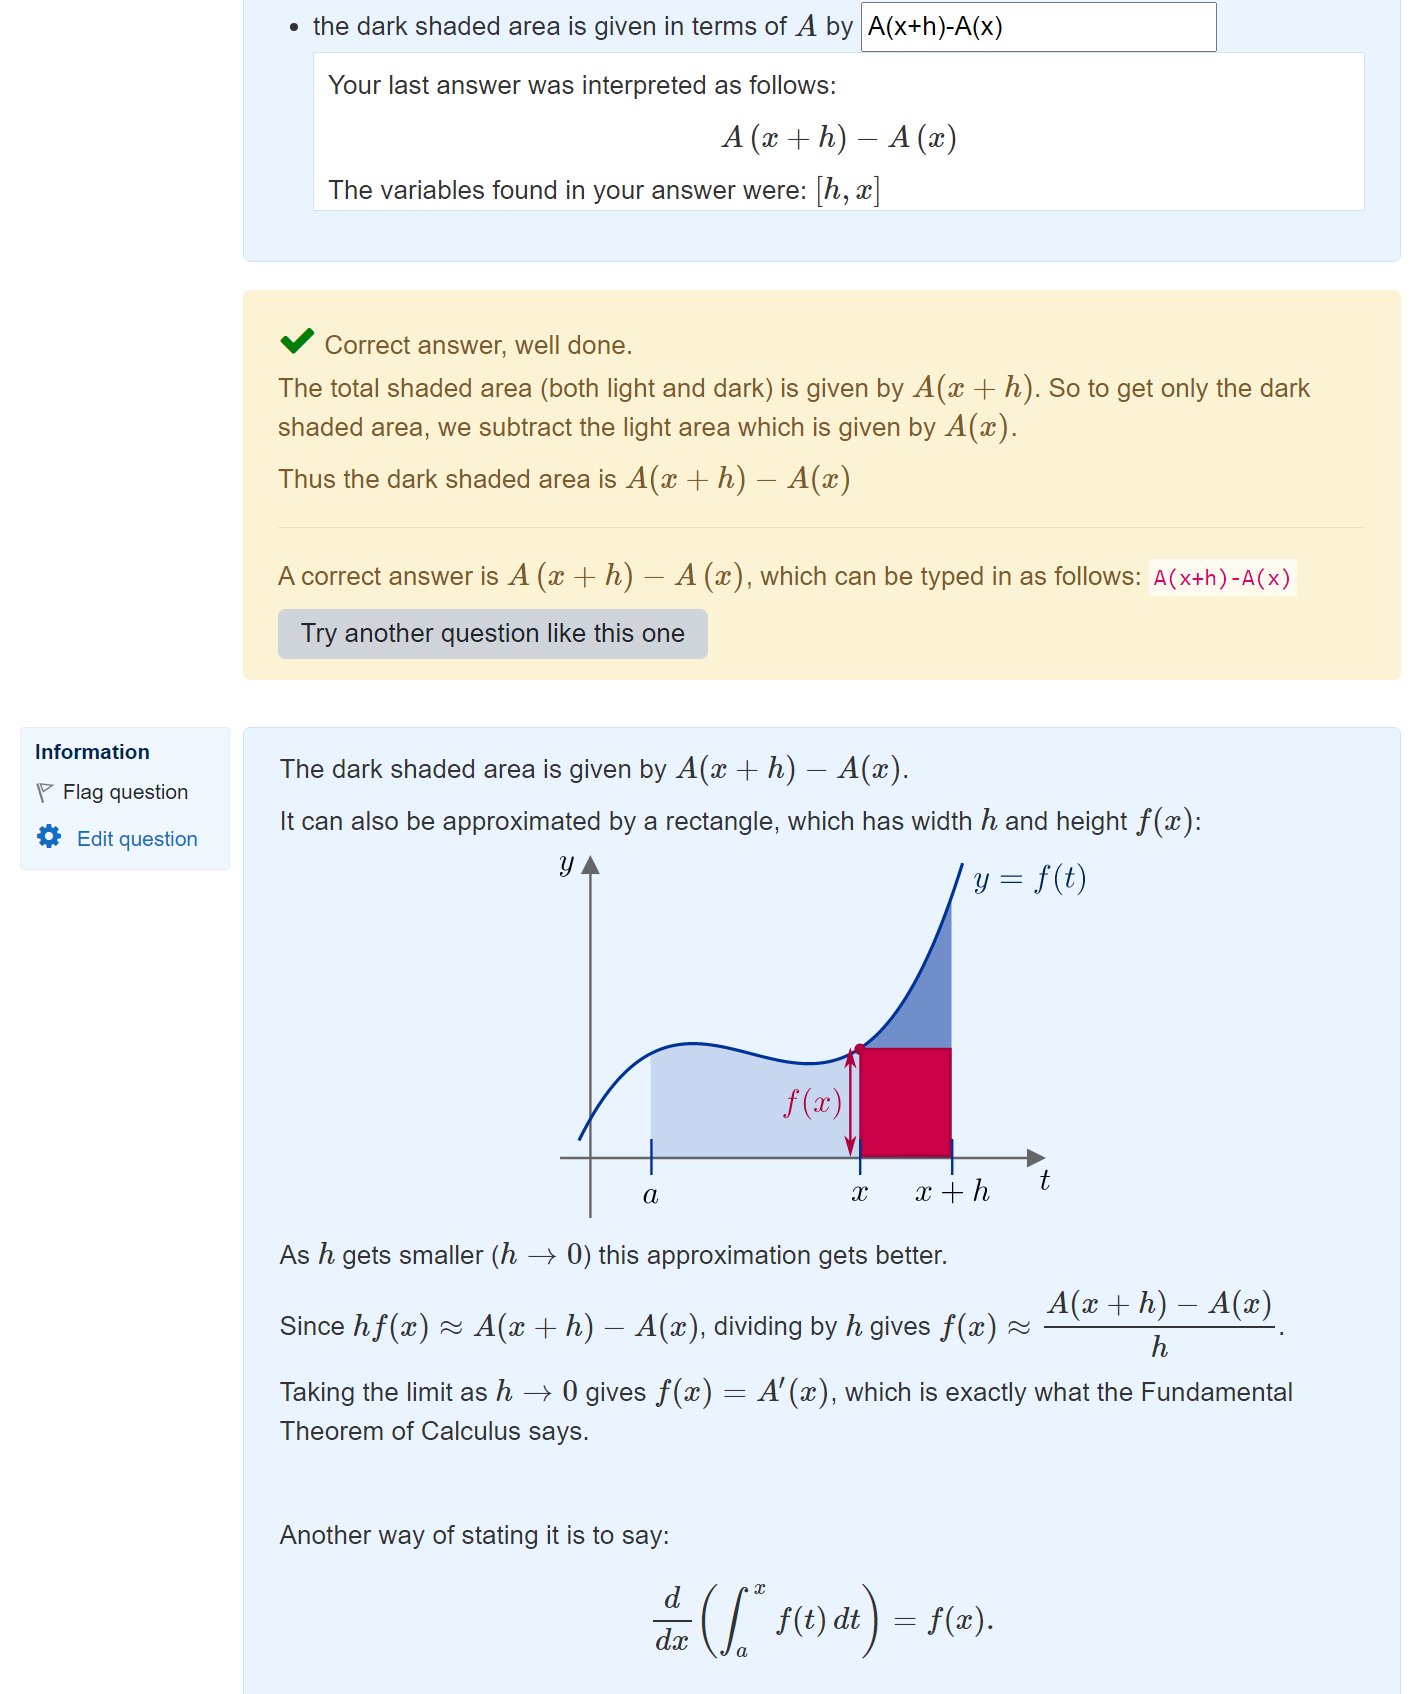
Students can’t see the next part of the proof until they give an answer. Once they have submitted their answer, the next part is revealed:
I’ve used this approach in other places in the course, sometimes with more than one step.
The way to do this in Moodle is by having the quiz settings set to “Interactive with multiple tries”:Then using the little padlock symbols that appear at the right-hand side between questions on the “Edit questions” page:
After clicking the padlock, it changes to locked to indicate that students must answer the first question to see the second:
I’ve not done any serious evaluation of this approach, but my intuition is that it’s a good way to direct students’ attention to certain parts of a proof and encourage them to be more active in their reading.
I’m working on a paper just now about my online course, Fundamentals of Algebra and Calculus. I’d like to include a high quality screenshot to show what the online course materials look like, and have finally found “one weird trick” that makes it easy!
Based on that, here’s an easy way to take a screenshot as a PDF:
Using Chrome, on the page you want to screenshot, open the developer tools (e.g. by right clicking the page and choosing “Inspect”)
Click on the “…” menu at the top right of the developer tools window, then choose “More tools” > “Rendering”. This should open a new pane with various options.
Set “Emulate CSS media” to screen
Now when you go to print the page in Chrome, and choose “Save as PDF” for the printer, you will get the webpage as it looks normally, rather than the special printer-friendly style.
For the page I was saving, I found that setting the paper size to A2 gave good results. I also set Margins to “Custom” and made the page slightly narrower. I think you just need to play around with the page size, scaling and margins until you are happy.
I also used the developer tools window to tidy up the page a little, e.g. deleting some irrelevant navigation boxes, and instructor-only tools.
Last week’s topic in FAC was complex numbers, and I’ve had some difficulties with STACK questions asking students to give their answer in polar form, e.g. when the correct answer was 4*(cos(pi/3)+i*sin(pi/3)) an answer of 4*(cos((1/3)*pi)+i*sin((1/3)*pi)) would be marked incorrect!
The issue was that:
with simplificatiwon turned on, Maxima will automatically simplify polar form to cartesian form, so I need simplification off.
with simplification off, Maxima won’t see those equally valid ways of writing the argument as the same.
I was using the EqualComAss answer test to check whether the student answer (ans1) was equal to the model answer (ta1), and this was failing in the cases above.
The solution I came up with is to add some code to the feedback variables box at the top of the PRT, to replace cos and sin with alternate versions so that Maxima can’t simplify the expressions to cartesian form. I can then use ev(…,simp) to make use of simplification when comparing the expressions:
This will ensure that COSINE(pi/3) and COSINE((1/3)*pi) will cancel out, thanks to the simplification being turned on.
But since Maxima doesn’t know anything about COSINE, it can’t cancel out COSINE(-pi/3) and COSINE(5pi/3) (as it would do with cos) if students give their answer with the wrong value for the principal argument.
It was then just a case of replacing the test for EqualComAss(ans1,ta1) in the PRT with a test that AlgEquiv(proper_form, true), and regrading. Out of ~160 attempts this picked up 8 students who deserved full marks!
Update (08/11/2021): One year on, and STACK now has a new feature which makes it easier to grade these answers correctly! The new EqualComAssRules answer test lets you add a list of different algebraic rules so that two answers should count as equivalent if they differ only by those rules – e.g. x and 1*x.
To fix this question, it’s enough to change the first PRT node to the following, using the “Test options” box to specify the list of algebraic rules:
I was pleased when the title of this post popped into my head, as it can be read (at least) three ways:
I’ve finally started this blog!
Depite setting it up shortly after the service launched nearly two years ago, I’ve never got round to posting anything.
I’m not making any promises, but I do want to try using this blog to record my thoughts – both about technical things (like code that I’ve written), and about theory (like my thoughts on papers that I’m reading about mathematics education).
I’ve been picking this up over the past couple of weeks, to do some work on the GradeX tool which we’re using to manage our exam marking process in the School of Mathematics. I’ve been pleasantly suprised with how quickly I’ve got up and running in this new language, though I do feel that at this point I am mainly hacking away to get things working, rather than trying to write “effective Go“.
We’ve got our exam marking process up and running
Since we are continuing to run exams remotely for students in Years 3/4/5 and on MSc programmes, there has been a pressing need to figure out how we will handle the nearly 3000 scripts that we expect to be submitted over the next few weeks.
I spent last week putting the finishing touches on our process for handling the submissions, and this week we’ve finally got the first scripts out to markers. I’ll now need to turn my attention to the checking/moderation process.
In the spirit of using this blog to record thoughts about technical things, I though I’d describe our process for handling exam submissions.
Submission. Students submit scripts to a Learn assignment. We’ve set this up to allow unlimited attempts, and made clear to students that only their last (on-time) submission will be marked.
Backup route. There’s also a backup submission route (through Microsoft Forms). We’re clear with students that we’ll only check this where they have been unable to upload to Learn for some reason.
Download. After the deadline, someone (currently me or Steven) downloads a zip file of all the submissions from Learn. We use the option to download all submitted attempts, since the other option (last attempt only) might mean that for some students we only see a late submission, when in fact they had previously submitted before the deadline.
Processing. We then run the gradex-ingest script on the unzipped folder of submissions. This also reads in the class list, which has each student’s UUN, anonymous Exam Number, and whether they are entitled to extra time for the exam. It takes care of the logic of deciding which submission to use for that student, and spits out a single PDF of that submission. It also produces a log file showing any submissions that were late, or malformed (e.g. students uploading multiple files, or non-PDF files).
Mopping up. There’s then a bit of manual mopping up to do. This involves checking the backup Forms submissions to see if there are any further submissions to add in, and also assembling a single PDF for any students who did not manage to do that. Fortunately that has been rare on all the exams so far.
Also, just to try out the new code highlighting tool on this blog, here is a crucial bit of code in this process:
// Decide if the submission is LATE or not
sub_time, _ := time.Parse("2006-01-02-15-04-05", submission.DateSubmitted)
if(sub_time.After(deadline_time)) {
    if(submission.ExtraTime > 0) {
        // For students with extra time noted in the class list, their submission deadline is shifted
        if(sub_time.After(deadline_time.Add(time.Minute * time.Duration(submission.ExtraTime)))) {
            submission.LateSubmission = "LATE"
        }
    } else {
        // For students with no allowance of extra time, their submission is marked late
        submission.LateSubmission = "LATE"
    }
}
This uses Go’s weird-looking syntax for parsing dates to read the submission time of the student’s attempt, then compares that with the deadline while also taking account of the student’s entitlement to extra time. Later on in the script, we skip over any late submissions, then pick out the most recent submission for each student.