
Student Perceptions of Learning Technology
Learning Technology solutions are now commonplace as part of the student experience at the University of Edinburgh; however, it can be difficult to gather meaningful feedback on how students interact with these tools and services. There are often assumptions made about how students use technology in their studies; these assumptions can then affect decisions on how courses might be developed, and how supporting systems are delivered to our students.
With support from an Information Services Innovation Fund we set out to look at the different approaches that can be taken to gather meaningful insight on our student’s perceptions of learning technology. We wanted to identify some baseline information about how they use core services such as Blackboard Learn, but also understand what approaches could be repeated in the future as part of continued service improvements.
What has already been done?
It was important to start by looking at existing studies, both within our institution and externally to see if there were any trends and outcomes that we could learn from.
Within the University there have been large student surveys conducted in the past, as well as localised school or service specific studies. Students often complain about the volume of surveys that they are asked to complete. The value of the surveys is often questioned by students as they are unsure on the benefit of the study, and there is often no clear communication channel for “closing the feedback loop”.
There was a range of different external studies to explore that looked at how students engage with technologies at University. The ALT – Student Voice study, Blackboard’s analytical based study of how courses are delivered, and the recent JISC – Digital Student Experience Tracker project were of particular interest.
Key messages for conducting student feedback and analysis:
- Understand the purpose of the data that you wish to collect
- Use the findings to highlight how this data can be acted upon, also highlight were no action is to be taken
- Develop a plan for “closing the feedback loop” and make it somewhere that is accessible to students
- Develop feedback approaches that are repeatable, but can adapt over the years
- Adopt multiple approaches for gathering feedback and analysing data and review their effectiveness regularly
- Build relationships with the students, schools, etc. to make it easier over time to run these exercises and show that they can be effective
- Try and make your feedback gathering fun and understandable to the widest audience
- Develop reports and analysis in a variety of formats that will have the widest reach
- Come up with a consistent way of delivering feedback and posting about the findings
Key Messages for student perceptions of Learning Technologies:
- The majority of students and courses are content focussed
- Consistency of service, navigation, terminology, and approaches are important in creating a stronger and better student experience
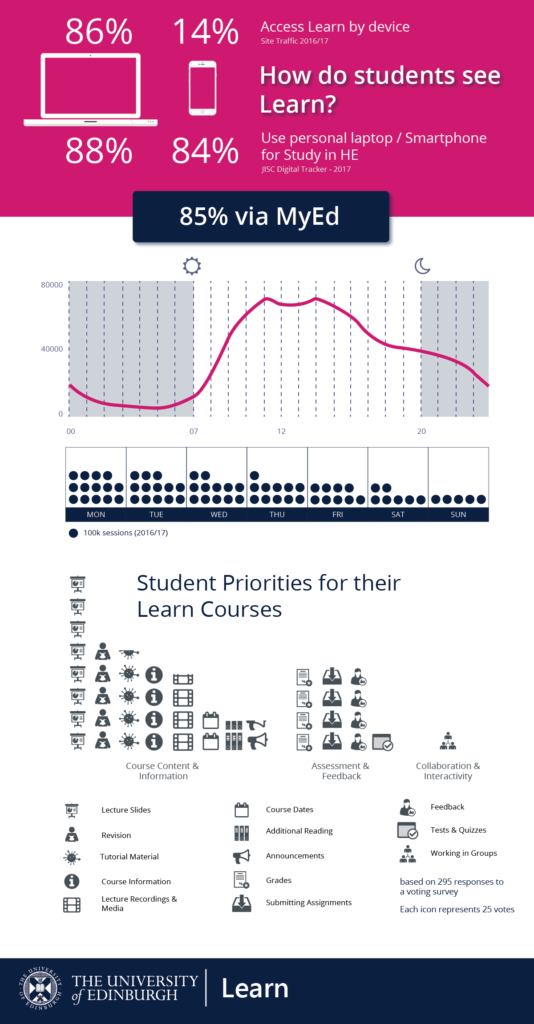
- There is a growing trend for students to use their own devices for studying
- Student expect things to work with little or no training required
- What is expected of the student should be made clear
- Communication and the channels used should be clear and consistent
- Students think the VLE is an important part of their studies but is part of a wider toolset of institutional services and personal technologies.
Our Background Research document can be read if you want to see more about the different areas that we explored.
What we tried…
Knowing that students were wary of completing yet another survey, we looked at some different approaches to trying to understand how our students perceive the learning technologies that they are interacting with. Many of the approaches that we took followed different UX based exercises, these were great to try out, but only scratch the surface of what can be done.
We were keen to see what our students prioritised when using technology in their course. We tried were possible to keep our data gathering technology agnostic, however there is a clear focus on the Learn VLE as it is often the main tool for accessing other services, and is often used as an umbrella term for other integrated learning resources and activities.
Our range of approaches included a Festival of Creative Learning event, which focussed on showing students different UX approaches in a workshop to help identify what tasks are most important when supporting courses. This workshop also included a fun collaborative sketching exercise for students to design their own learning technology tool based on their priorities.
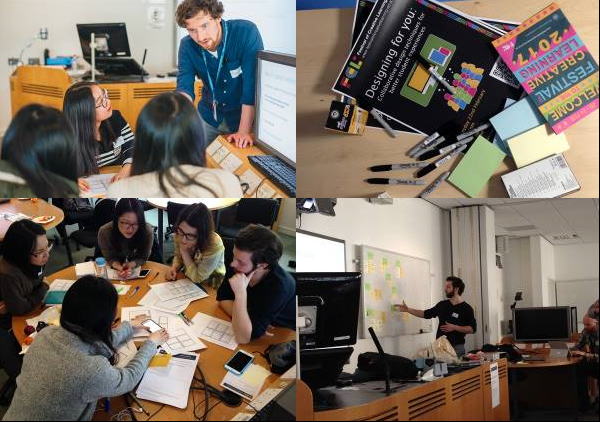
We conducted a number of focus groups with students. We had one general focus group for any student, as well as a session that focussed on students who were in their first year of their studies to give perspective on how they familiarised themselves with the different tools with no prior knowledge of the University systems. Another group we had a session with were students who are also tutors on courses, as they have a unique view from both student and tutor perspective.
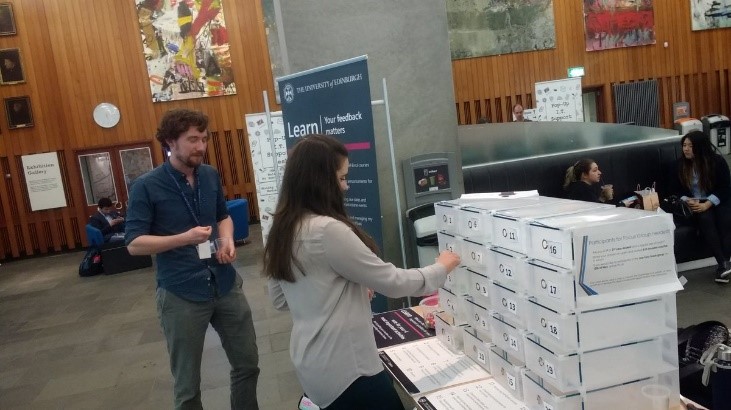
Our final approach was a top-task analysis voting exercise. This is similar to a regular survey, but students were given coins to vote for their areas of priority. Feedback on the day from students indicated that this type of activity was more interesting and fun compared to a survey, and they would be more likely to take part.
We collected and analysed system data for the Learn Service to help validate and sense-check some of our exercises. We had limited time to gather a wide selection of data to target specific questions that we were coming up with, but we have established some baseline information that we will now build on in the future.
What we found…
It is worth highlighting that the students that we engaged with were generally pretty happy with how technology is used in their courses and the services that have been adopted by the University.
Our findings may be unsurprising, and do align with much of the background research carried out. Students want a more consistent experience when accessing information from their courses, they want clearer definitions on where certain information will be found, and how they will be communicated with via the different systems they use.
Our top-task analysis showed that students prioritise accessing their course content, course information, assessments, grades and feedback. This is not to say the other facilities in the VLE are redundant, but the student priorities should be catered for in a more consistent way. We also found that student opinion was shaped by their existing experience, and the experience varies from course to course and school to school quite dramatically.
In our focus groups the above themes continued. In some cases, we had students coming up with different technological interventions that could would improve their courses, only to find that the approaches already exist and had been adopted in other courses attended by peers in the focus group. In these cases, there was clear frustration from the students about a missed opportunity, however prior to that they were actually fairly satisfied with their learning technology experiences.
What next?
It is clear that engaging with students to gather feedback, and using analytical data can provide very useful insight and should be part of our practice. There are challenges and the work can be resource intensive. Our project has highlighted how the process could be made more efficient by making it easier to share findings and identify existing feedback approaches that could be combined rather than repeating similar studies.
It is also clear that the information that is discovered in projects like this should be shared more widely so it can be of benefit to other areas of the University. Our project has looked at how to share detailed findings with relevant communities. We have also looked at how infographics and videos could be used to make some of the headline findings and planned/delivered action are visible and understandable to the wider audience, in particular the students.
Our full report is available with links to additional appendices. There are plenty of more nuanced findings from this process too – if you would be keen to find out more please feel free to get in touch.
Ross Ward