Any views expressed within media held on this service are those of the contributors, should not be taken as approved or endorsed by the University, and do not necessarily reflect the views of the University in respect of any particular issue.
Digimap is an online map and data delivery service, available by subscription to UK Higher and Further Education establishments. Operated by EDINA at the University of Edinburgh, Digimap offers a number of data collections, including Ordnance Survey, historical, geological, aerial photography, LiDAR, marine maps, land cover mapping, global mapping and census data. For more information about Digimap go to our website: https://digimap.edina.ac.uk Background image Contains OS data (c) Crown Copyright and database right 2022
EDINA has launched a new version of Geology Download to replace the existing one and the Lexicon Download. The updated interface can be found in the Download area of the Geology section of Digimap.
The new interface looks very similar to the Data Download service in the Ordnance Survey Collection and so benefits from all the enhanced functionality and ease of use brought about when that interface was developed:
New Geology Download has all the datasets that the old interface provided, with the addition of the Lexicon of Named Rock Units and the Boreholes Index shapefile. We also hope to add some extra datasets in the coming weeks from the British Geological Survey (BGS) OpenGeoscience data holdings.
Both the old Geology Download and the Lexicon Download will be withdrawn on the 31st of August. If you support the use of Geology Digimap please update any support materials or practical exercises you may have created for the old interface.
You can find a “how to” guide for the updated interface here:
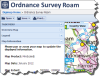
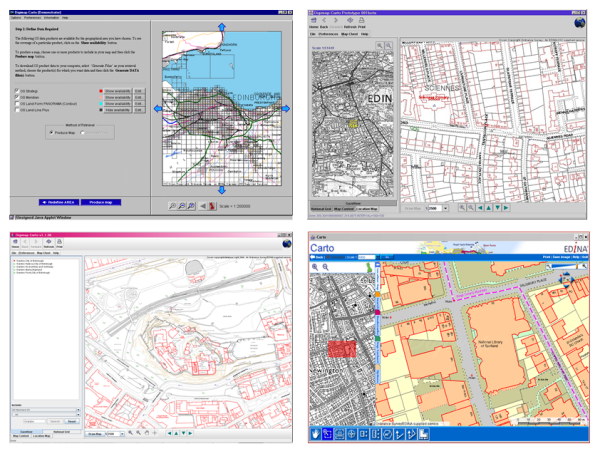
At 11:00 am access to Digimap Carto will be closed and by 12:00 noon it will have made its last map. Carto was at the cutting edge of web mapping technology for several years, delivering Ordnance Survey maps to thousands of users while Google was still just a search engine. The high quality EPS and then PDF print files it produced meant that staff, students and researchers could print out maps of anywhere in Great Britain and were no longer limited to their library’s collection.
Carto over the years 1998 to 2013
As time passed Carto could easily keep up with the latest offerings from MultiMap (later bought by Microsoft and eventually becoming Bing Maps) and Google Maps. It had more advanced tools and much better data in the form of OS MasterMap, so as the Java updates got more frequent we all put up with the software being a bit unreliable for a few days before we could issue a fix. However after 2011 the number of Java updates ramped up significantly and the changes became more difficult to accommodate. Once anti-virus software began seeing Carto as a potential threat and preventing it operating we decided that maintenance was unsustainable.
EDINA realised that continuing to support Carto would be too costly in terms of developer time spent fixing problems rather than improving and enhancing the service. In the meantime the rest of the world had become much more accustomed to viewing maps online in a web browser; EDINA’s other mapping service, Roam was able to take on much of what Carto was offering without confusing or frustrating its users.
Some recent changes to the capabilities of the web mapping platform that Roam uses meant that we could finally offer a Carto replacement without the need for any software to run on the end user’s computer. These changes have allowed us to withdraw Carto and let Roam to take on all the mapping duties for Digimap. We can now get on with the business of all those improvements and enhancements we have been wanting to make. We hope you will like the changes that we are aiming to have in place this August:
As part of ongoing efforts to improve the usability of data delivered by Digimap, we have made some significant enhancements to one of the Ordnance Survey licensed datasets.
OS VectorMap® Local is a relatively new product from Ordnance Survey providing slightly less detail than OS MasterMap but still very useful for detailed backdrop mapping. Individual buildings are shown as well as roads, rivers, landcover and contours. The vector version of the data is provided by Ordnance Survey in GML 2.1.2. This is a standard geospatial data format developed by the Open Geospatial Consortium; however it generally needs to be converted into a proprietary format before being used in GIS and CAD software.
To make using this data easier we are now providing OS VectorMap Local in both Shapefile and DWG formats. Shapefiles can be easily opened in ArcGIS and most other GIS programs including OpenSource GIS software such as QGIS and gvSIG. DWG is the native format for AutoCAD and can be used in many other CAD systems as well.
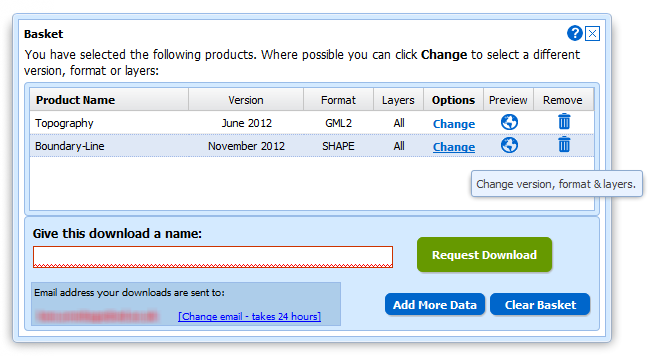
This data is now available for download from the Data Download application in the Digimap Ordnance Survey Collection. VectorMap Local is in the Vector Data section; to change the format of the data you are downloading click on the Change link under Options once you have added it to the basket.
Click image to view full size.
Creating the data:
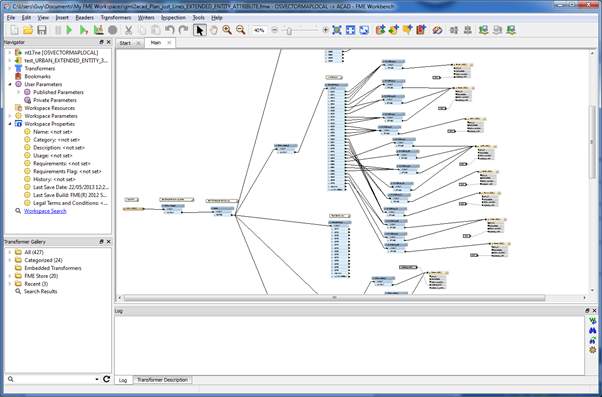
TO achieve the best results when recreating the data in different formats we had to use different software products for different formats. To convert the data to Shapefile we used the OpenSource Software GDAL program called “ogr2ogr” and for the DWG conversion we used FME from Safe Software. The image below shows part of the FME Workbench project used to convert the data to DWG.
Click image to view full size.
1: Shapefiles
To convert the GML to Shapefile we created a lookup table between the Feature Codes in the GML data to Shapefile Layers. As Ordnance Survey do not provide any guidance in their User Guide as to how to group features in VML , we analysed the data and experimented with various groupings, so that in the end we split the data into a possible 22 separate Layers. These layers may contain multiple feature classes but as they all have the original feature codes on them as attributes as well as all the other original attribution, further distinction between features can be achieved for representation and querying.
Example of the Shapefile data in ArcMap:
Click image to view full size.
A simple set of Layer Files has been created for use in ArcMap and can be downloaded from the VML Help page.
2. DWG
To convert the data to DWG we had to go through a similar process (as well as our data team becoming much more familiar with AutoCAD). We originally intended to produce DXF format data but this turned out to be a problem. We had to make some decisions about how to store attribution in the output data and one of the main considerations was the size of the resultant files. To begin with when we converted a tile of VML that was 60Mb of GML, it expanded in size to 240Mb when converted to DXF containing attributes as Inserts. This was unusable in systems we tried so we had to work on ways of making the files smaller. The first thing we did was change the format from DXF to DWG. As both formats are commonly read by various CAD systems this seems a reasonable thing to do although it may make the data slightly less interoperable. This changed the file size to 44Mb for our sample dataset. This was still quite large and some systems were having problems with this, especially when dealing with tiles in dense urban areas. We therefore decided to change the way we were storing attributes in the data. Instead of using Inserts we used Extended Entity Data (or XData) which was one of the options available in FME. This stores a fixed amount of information against an entity in the drawing. We use this to store the attribute information that was in the original GML data, including the original feature code. It’s a bit more difficult to work with this data but it can be viewed in AutoCAD Map 3D by using the Express Tools –> Tools –> List Object Xdata or typing xdlist in the command prompt.
Using XData brought the size of our sample tile down to 10Mb and was usable in all the systems we tested it with. If you need access to the attributes either as Inserts or as Map 3D Object data please let us know.
As part of the conversion process we defined the representation for features in the DWG file, including point symbols and area fills. Features have also been grouped together into separate Layers as we did with the Shapefiles.
Example of the data in AutoCAD:
Click image to view full size.
Finally, after getting the project set up in FME and a thorough testing of the data, we ran the batch process to convert the data. This took nearly 3 days per format to convert the full load of our national coverage of VML data. This data will be updated on the normal update schedule, as we get updated VML from Ordnance Survey as Change Only Updates so future conversions will be much quicker.
Remember,both these datasets are available through Data Download by selecting VectorMap Local and then changing the format after you have added the data to your basket.
We intend to produce alternative formats for other products, including OS MasterMap, so we would very much like to hear your thoughts on the data that we have produced so far and let us know if this meets your needs.
As part of our work to demonstrate the impact of Digimap, EDINA has calculated the commercial value of all the data downloaded and maps created for printing. We calculated the values per institution for the period August 2012 to May 2013 then totalled them; this came to approximately £39 .5 million. This estimate is a conservative one as we reduce the quantity of data downloaded by 60% to account for duplication. When all the maps printed and data downloaded were included in the calculation (i.e assuming users would continue to take their own data and maps, and not share them) the value rises to nearly £71 million.
Click to enlarge image.
We know that some data is downloaded multiple times within an institution, for example by the students in a class exercise or for specific study sites. We found that only 40% of the data taken from Digimap over a period of time was unique to an average institution. We believe that if institutions were paying commercial rates for their data it would be more likely that they would try to download it once and then circulate it to those who need it; for this reason the value calculations only include 40% of the total. However, there is considerable variation between institutions as to how much is unique; those that do more research or are smaller in size tend to have a greater proportion of unique downloads, so we have included the 100% figure as a ceiling value.
In total, over the past three academic years over £190 million (£100 million at 40%) worth of print maps and data has been served up from Digimap to subscribing institutions.
How the Costs are Calculated
Click to enlarge image.
The costs used in our calculations for the data downloaded come from the data suppliers, and include any relevant multipliers or discounts made publicly available on their websites.
The data values are calculated on a per product / per institution basis, with the data preparation and licensing charges assigned only once per product, per institution. Many of the data collections are licensed based on the number of users who have access to the data; with increasing numbers of users a multiplier is applied to a base cost. We applied the relevant multipliers based on the number of active registered users for each collection at an institution. SeaZone data is provided commercially through a third party website; we picked the closest match possible to the data we provide though this does have a lower cost, again making the estimates conservative.
We capped data values at the price it would cost to take national coverage of each product, making it impossible to charge more for any one product than it would to supply the entire dataset for use by the whole institution.
The values for the print maps (including saved images in Carto and Ancient Roam) are calculated by finding the cheapest available commercial map prints from websites such as eMapsite, NLS and FiND. These values are updated every time we calculate the values.
What We Didn’t Include
Click to enlarge image.
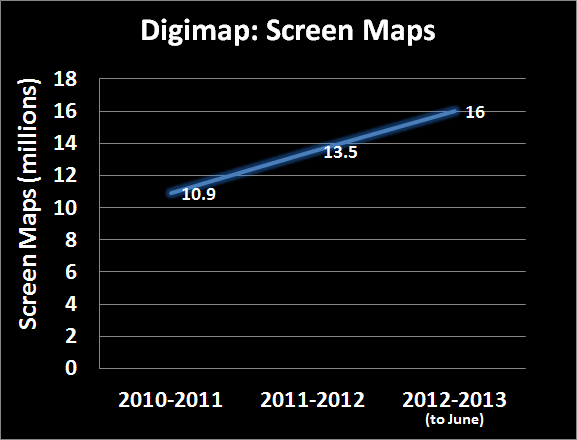
No monetary values were assigned to the millions of screen maps that are produced from Digimap; we couldn’t find a comparable site! Also, the value calculated doesn’t take into account any of the support materials, training courses and help desk facilities that are all part of the Digimap service.
No OpenData downloads or maps created from OpenData are included in the calculation, despite the advantages of producing them from Digimap over other websites.
However the biggest saving that isn’t included in these value calculations is your time. We only charged the data supplier’s preparation and licensing costs once per product or order, in line with each companies policy. In reality there would be many orders occurring throughout an academic year as new research questions are raised. This all costs time, time which the data suppliers will charge for or that institutional staff would have to take to put in requests for data or to create and manage a repository for spatial data.
Digimap does all this work for its subscribers along with providing a high quality mapping interface, 24 hour access to expensive high quality data and maps.
Over the coming weeks we will be sending out each institution’s values to Digimap site representatives. If you are interested in the value of the maps and data your institution has been using then get in touch with them. If you are unsure who your site representative is then please contact us:
Geoforum aims to bring together staff who support the use of Digimap and other geoservices from subscribing institutions around the country and showcase what’s new and upcoming from EDINA. It also gives people an opportunity to ask the Digimap team questions and to chat with others about how support and promote geoservices.
There was a live blog running throughout the day which is still available for you to read and find out what happened.
Keynote Address
The keynote was delivered by Shelley Mosco of The University of Greenwich and was titled: Digimap Data and a non-traditionalist approach. Shelley is a member of the The School of Architecture, Design and Construction and described the ways in which spatial data could be used to inform design. Shelley was keen to stress the importance of spatial data and GIS in the implementation of Building Information Models (BIMs). BIMs have been used in large engineering projects for some time, however the government is making them mandatory for all publicly funded building projects in England and Wales. This means that commercial organisations will be looking for students to have been trained in the concept of BIMs and the software that drives them. You can find out more about BIMs through the following links:
BIM Task Group – government site promoting best practise for BIM
COBie – Construction Operations Building Information Exchange
Two of Shelley’s current MSc students also gave brief overviews of their experiences of learning about GIS and using spatial data in their projects. Both David Parfitt and Robert Park were self-confessed GIS newbies, but they managed to get data from Digimap and use it in their conservation projects. The data allowed them to visualise and analyse the environment and provide evidence to support their proposed designs. Their demo’s were excellent a they really showed the power of simple GIS analysis.
You can view the slides from this presentation here:
After the Keynote was a presentation that focused on Open or “Free” resources for geospatial teaching and research. The presentation looked at software, web-mapping and data. The main resources are listed below:
Data
OS Open data is available through the Digimap Data Download service.
ShareGeo Open is a repository for open geospatial data. It has lots of useful and interesting datasets on a variety of subjects such as wind farms, crime, boundaries and DTMs
QGIS – one of the best open source GIS out there. Lots of functionality and plugins that allow you to perform complex spatial analysis. It is also well supported by forums.
GRASS – a remote sensing package aimed at serious remote sensor’s. If you are a newbie to remote sensing, you can access GRASS tool through the GRASS plugin for QGIS which makes things really simple.
Web-mapping
Digimap is a great web mapping tool, but how can you create your own interactive web map for your website?
MapBox – simple intuitive web site that helps users build interactive web maps. Basic functionality is free, more advanced functions are available for a small fee.
Leaflet – the engine behind MapBox, it is free but requires user to do a “bit” of programing
Openlayers – an alternative to Leaflet which is more flexible. Openlayers powers Digimap. Requires a fair amount of programming knowledge.
MapServer – implements Openlayers for enterprise scale operations. MapServer is also used for Digimap services.
You can view the slides from this presentation on slideshare here:
After lunch the lead of EDINA’s geoservices Support team, Emma Diffley, shared what we have been busy working on.
Interfaces
Digimap is being streamlined, each collection will eventually have just a Roam and a Download. These interfaces will all look and work in a very similar way. The aim is to make the service more consistent and easier to use, but also much easier to maintain.
EDINA will be withdrawing Digimap Carto on 31st July 2013. Carto, launched in 1996, is harder and harder to maintain, so we have taken the best bits and put them into Roam.
On top of the Carto functionality already added to Roam the following improvements are coming soon:
an improved way of saving and opening maps and annotations
a Basemaps button to change the style or even mapping product you are viewing at each scale
The Download interfaces will also going through a similar process.
Data
A single consistent style for all the vector products through all the scale levels accessible through using the basemaps button in the new Roam.
VectorMap Local (VML) in shapefile and DWG formats
ArcGIS layer files for symbolising VML shapefiles coming soon
OS MasterMap Topo available as DWG is being planned
Support
There is a new Resource Centre, which does not require login, with answers to questions, videos, case studies etc.
Beyond Digimap
GoGeo has added more resources and now highlights the “Editor’s Picks”
ShareGeoOpen now has over 210 resources all of which are open and free to use
FieldTrip GB is a mobile app for capturing data, see below
GeoTagger – a tool to allow you to edit the metadata for your photos
Cartogrammar – upload your data and visualise it in different ways
UKBORDERS is now the UK Data Service Census Support Unit
On the horizon
We are still awaiting news on funding, but are lots of things we would like to do. Currently our focus is to “mobilise” more services and we will be continuing to add new support materials once the latest round of Roam and Download changes have been made.
If there are things you would like us to do we really want to hear about them. Recommendations from the user community carry real weight for us, and we are keen to hear ideas on new data or services we should be providing.
You can view the slides from this presentation here:
The final part of the day was about EDINA’s new mobile app for carrying out field work Fieldtrip GB. It simplifies the process of capturing data in the field against quality cartographic mapping. It is equally at home in urban environments as it is in rural ones. Custom forms allow users to design their own data capture projects and collect exactly what they need for their research. The session gave a brief overview before running a “live” group data collection exercise. A custom form was created and deployed to participants mobile phones. They then headed outside and captured data on things like building fabric and design. After 15 mins everyone reconvened and the collected data was “synced” and exported to Google Earth.
You can view the slides from this presentation on slideshare here:
As mentioned earlier, there is a transcript of the whole day in the form of a live blog so if you didn’t manage to attend and want to find out what happened please have a look.
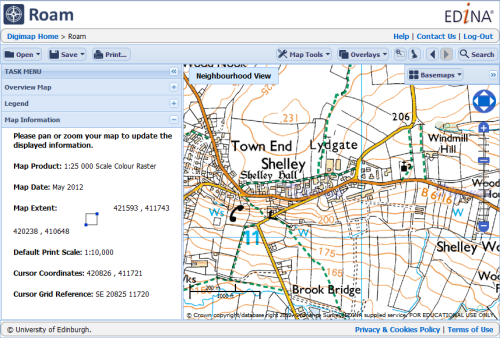
The Digimap Roam interfaces will receive some important updates over the summer break. The changes will make Roam’s functionality consistent for all collections and allow new functionality to be more easily added. These changes will also improve usability, making some previously hard to find options much more visible.
The main changes being made are as follows:
All the roams will use the same colour scheme and styling along with consistent buttons and terminology
The Search function will have a new interface
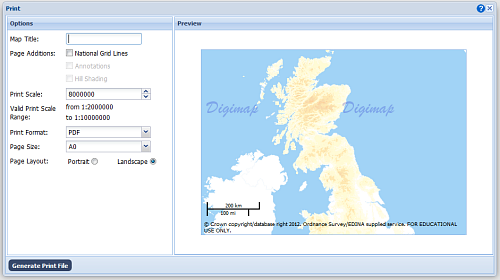
The Print function will have a new interface
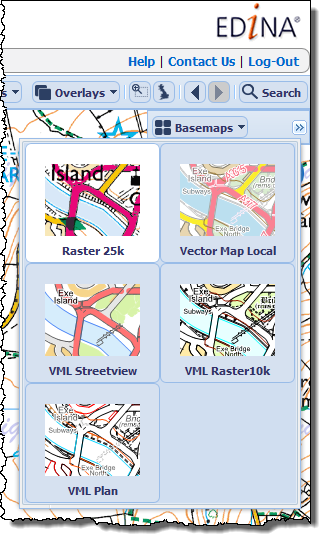
Users can change the map style using the new Basemaps button
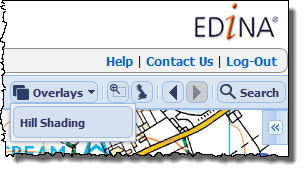
Users can add extra data using the new Overlays button
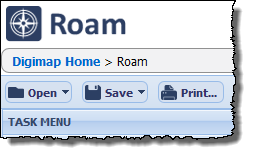
Opening and Saving maps and annotations will be done through buttons in the top menubar
Please note that the images below show the current state of the interfaces; they are still in development and so are subject to change.
1. All the Roams will use a common interface design, however there will be some features that are unique to each one, such as the time-line in Ancient Roam, but generally each one will look very similar and work in the same way.
2. The new Search interface will appear when you click a button in the top menu rather than in the sidebar to the left of the map. Although there may not be many differences to begin with, this change will allow us to add in more ways to search for your location in the future.
3. Initially the new Print interface will be very similar to the current one in Digimap Roam, though it will now appear in a new interface when you click a button in the top menu. The main advantage with initial changes will be that print sizes up to A0 will come to all collections (except Historic) as well as user defined print scales. We are planning more extensive changes to the Print interface in the near future.
4. Users can currently alter the style of the map by changing the Map Theme in the legend. This functionality is quite hard to find so in the new Roams we are adding a Basemaps button to do this. Where available, users can select from a list of alternative styles, such as MasterMap in the old LandLine style. In addition to the existing extra Vectormap Local and MasterMap styles there will be new styles for Vectormap District, Meridian and Strategi datasets coming soon.
5. We are adding an Overlays button so that users can add additional data layers on to the map. Initially this will be the hill shading already provided in Roam, however we hope to add Postcode Boundaries and Contour lines soon. This functionality used to be available in Carto several years ago but was lost when we moved to a new GIS platform, it is now making a welcome return.
6. Finally, we are introducing Open and Save buttons as ways of saving your maps and annotations and then opening them again. These buttons replace the My Maps section on the left side of the map and the Save, Open and Export buttons in the Annotations Tool bar. The aim is to make it much easier to see what you are saving and opening. It will also make it more obvious that you can open annotations you have created in one Roam interface in any of the others you have access to.
If you have any questions about the new interface or anything else then please let us know:
GeoForum 2013 takes place at the Congress Centre in London from 10am until 4.15pm tomorrow. Throughout the day we will be liveblogging so, whether you are able to join us or not, we suggest you bookmark this post (link here) and take a look late tomorrow morning for notes from Shelley Mosco’s keynote. Keep an eye on the same post throughout the day as it will be updated after every session. We also welcome your comments (below) whether during or after the event.
You can also take part in GeoForum 2013 via our Twitter hashtag, #geoforum2013, where you are welcome to comment, contribute and engage with the Digimap team and our GeoForum attendees. We will also be tweeting key updates, images and notes from the event so if you don’t already follow @EDINA_Digimap, now’s the time to do it!
Please Note: This is a live blog so please do excuse any typos, spelling issues, etc. and do let us know if you have any corrections, clarifications, or information to add – we’ll be happy to update the post accordingly.
Welcome – Emma Diffley, EDINA
Emma is welcoming our attendees to GeoForum 2013. We hold a GeoForum regularly but not every year so we are delighted to be holding this event this year but the next GeoForum may not be in 12 months time. Since we last met we have had a busy year. And we have been watching closely the changing funding and financial landscape as well as the changing strucure of Jisc. There is lots coming in the future and we’ll be showing you some of that today.
This afternoon we have an outdoor excursion, it’s a bit weather dependent, but either way there will be an interactive activity with FieldTripGB – even if it has to be indoors!
Keynote: Digimap Data and a Non-traditional Perspective – Shelley Mosco (with Robert Park and David Parfitt)
Shelley Mosco is a practising landscape architect and senior lecturer in GIS at the University of Greenwich in the School of Architecture, Design and Construction. She is also involved in research of living walls and green roofs as part of the school’s Sustainable Landscapes Research Group.
I am so happy to see you all here – I know that some of you have come a very long way to get here today – I’ve probably actually come the shortest distance! I will be presenting with my colleagues Rob and Dave, who will be showing you some of their work.
What I hope to achieve here this morning is that I know there are several people here from library services… I know some of you are keen to hear a bit more about how you can help the students find out what could be done with Digimap, how it is used in practice. And Rob and David will show you how they have been using Digimap. What I’m going to talk about first though is how landscape architecture uses GIS and Digimap – we are something of a non traditional discipline – and then show you some of those specific projects, and to introduce what’s yet to come. And a little bit on our new school building with nearly 4000 square metres of roof space for gardens, agroponics, etc. and we will be looking at collaboration, sponsorship etc. for use of that roof space.
I’ve mentioned a little about famous lanscape architects. Ian McHarg came from Scotland originally, and he eventually moved to America teaching at Harvard. We think of him as the grandaddy of GIS. He looked in the 1960s at the landscape as a whole, really connecting across to other disciplines. What he did, in addition to teaching, was he had his own practice. He was asked to build a new highway to New York. He had about 200 criteria to think about. He used a thing called “SIM” analysis. This is pre-GIS, this is all manual work with maps, felt pens – colouring in shades of grey or black for inappropriate areas. After 200 or 300 odd layers/overlays – and that layering is something that he, Jack Dangermond, and Carl Steinitz are particularly known for. So these origins of GIS and overlays actually come from a group of Landscape Architects.
At Greenwich, how it works, we taught using Ian McHarg’s examples as well as the work of Jack Dangermold and Carl Steiniz. That’s the place our thinking comes from. And that idea of layers, of finding the right location through shading and colouring. We’ve taught GIS to landscape architects since 1995 – when via DOS prompts. In 1996 there was a reaccredition and it was decided that landscape architects needed GIS the same way that we need AutoCAD. Now I don’t teach the SIM approach, I come at this from the perspective of a practicising landscape architect. It is about practical projects, wherever it is in the world, and they have to use GIS for that. GIS is a way to look at time, place and patterns. For me GIS is particularly powerful for looking at those patterns, for finding them. You can do that with SIM analysis but GIS allows you to do this in lots of ways quickly.
So looking at various views from Digimap here – we look at Base Plans, Topographical Analysis, 3D Data ArcScene) and Data Analysis. Using all these views allow us to find the best options, the best plans here. We have some of the best practicising GIS specialists at Greenwich, and we are trying to set up a Centre for GIS excellence – watch this space!
So, David and Rob will show you their projects shortly but I wanted to show you some of the best student projects from the last few years.
So this is Zoe Antonald’s work, looking at creating an Oxbow habitat around the O2 arena area. She’s used a vast amount of data, including historical data, to identify the best site for the Oxbow and created a 3D model and flythrough.
James Penney’s project looks at non permeable areas and ways of creating attenuation zones to reduce flood risk.
Paul Hadley looked at the “Boris Island” airport in London. He looked at the Norman Foster design but critiqued it from a landscape architecture perspective, particularly the maintenance of the special area of wildfoul and wetlands in the proposed area. He has identified where the site boundary should be, he’s looked at contours and topography, and he’s looked at some of the historical data for surface water flow accumulation. So where the waste water area occurs that should be more wetland than that. And proposed a new use of space and way to fit the airport into the environment.
Joe Perkins looked at ways to transform the Valley Gardens in Brighton and done an assessment of the site based on what it is and what it could be, based on Yann Sizeman’s work. So he has looked at why it was set up like that. He has located it towards heaviest footfall, also to traffic. He has looked at crossover of pedestrians and traffic – identifying why the green areas were not being used as much as they could.
Jiamiao Xu looked at Vauxhall Pleasure Gardens. Looking back to it’s past as open fields, and planning a nice open space. Using hydrology to inform Sustainable Urban Drainage and Attenuation plan – as part of his master plan for that space. And looking at sightlines at present and how this could be changed to creating more land form, more water, more biodiversity. And he also looked at access to the site. Looking at cycling distance, location of river boats, wanting everything within a 5 minute walking zone.
So… what’s new?
BIM. BIM is new for landscape architects – bit more established for architects. So, what is it? Building Information Modelling. One of the definitions (from Landscape Institute) defines it as building a virual digital information 3D model, rich in data that can inform the decision making pricess and answer quesions throughout the entire project lifecycle, implemented in a collaborative environment. It is about that Ian McHarg idea of collaboration and about sharing data across the full life of a project. As a landscape architect you understand that, for instance, for a tree the root system will spread and go underneath paving etc. Understanding that paving, what may happen, how that relates to other systems etc. is really exciting. From 2016 it is obligatory that all publicly funded projects must use the BIM approach. We have already had an email from the Institute for Landscape Architects to say that practices are already using BIM in private practices and want to recruit students who understand and are trained in BIM. And that is likely to therefore be crucial for accrediting degrees. The time is now for incorporating BIM.
Just to explain a bit more about BIM. You can take the same approach to, say, planning lunch. There are 38 different models for this. You have a Project, an Assembly, Materials. This is about planning with different permutations. This is the same concept – picking your bread, your sandwich fillings etc – are the same for architects and landscape architecture. This is mandatory information that must be provided at each stage. The Cabinet Office has created a template/package for this – COBie: Construction Operations Building information exchange. For me the tools for BIM will be GIS of course.
Now over to one of my students: David Parfitt.
My project is based around the Wandsworth area and the area around the River Wandsworth post industriliasation. There have been some projects to improve the landscape but I wanted to create a masterplan to connect and join these areas together. I used digimap to find the location of hard features, to look for opportunities. I had only used GIS for 12 weeks but I was able to use historic Digimap data to identify a large area of marshland that had been lost over the last 150 years or so. There is one tiny area of wetland recently introduced but overall it has been a huge loss of that type of landscape over time.
I also used topographical data to look at potential improvements, using contour mapping for flood prevention for instance. And making changes to the landscape to make it easier to engage and interact with the area. There is still wildlife present in the river so I wanted to focus on the water and look at incorporating that into the design at multiple levels. Looking at increasing the space for wildlife, but also for people to use, and to allow the river to expand in times of flooding. And I was able to create a masterplan using that GIS data and AutoCAD to propose new design aspects.
And finally to another of my students: Rob Park…
I have been at the landscape architecture course at Greenwich for the last year. It’s been a very steep learning curve with GIS. If you’d asked me what GIS is even 6 months ago I wouldn’t know. But I have learned how to use it, and I have enjoyed using it, and I’ll be showing you how central MasterMap data has been to creating this design. My own design is looking at redevelopment of an MOD site around the South Thames Estuary and Marshes (SSI). Indeed there are many SSI’s around the site, particularly close to that area of redevelopment. I spoke to the RSPB and they explained that one of the key SSI area issues is around habitats for the Nightingale, which is endangered and does have key nest sites here. So I had two choices. Suggest that no development takes place… or come up with a plan.
I used Mastermap to find out more about the area. I wanted to properly survey the site but being a former MOD site it’s surrounded by fences and I wasn’t allowed on to take photographs. So with that limited access I began to fall in love with GIS. I found 30 different types of habitat, and used that data to see which of those habitats is most useful to the Nightingale for nesting. Red are habitats the Nightingale depends on, Orange and Yellow are supporting habitats – so some development would be possible there if sensitive. That leaves large white areas on the map for development. And I wanted to create a sustainable community, including buffer zones around houses to mitigate their impact.
I didn’t have a clear idea of topography but ArcScene let me get some idea of that with the elevation data, to fly through that data. I also plotted the water accumulation data to see where flooding and water occur. 3D is great but for masterplanning the 2D data is really useful. I used some tools in Arc Map programme to look at that water accumulation, and what would be needed. This is drainage not based on pipes in the ground, but based on topographical features. I began to think about how to increase wetland, particularly wet woodland, the habitat most in decline in the UK. I also used data on the degree of slope and direction faced for planning planting and development.
So in a rapid process GIS lets me get a handle on issues pertaining to the site and to formulate a strategy, even without access to the site. And thus created a masterplan for a Zero Energy Development on the Hoo Peninsula.
Whilst I was working on the project Natural England deemed the site a triple SI. I felt sort of exonerated as the data I used from EDINA led me to the right sort of conclusion here.
Back to Shelley…
I do hope that this gave you an idea of how Digimap helps us as Landscape Architects, and how GIS is central to that.
Q&A
Q – Karl Hennermann from Manchester) I think Shelley’s comment about BIM – that’s very relevant. We hear from engineering companies how crucial it is for graduates to have BIM skills. There is a BS standard out there that includes those BIM requirements for 2016. We are struggling with how to teach this to our students, there are software products – do you have any particular recommendations.
A – Shelley) I would like to join you in trying to figure this out. We need to learn more about how to integrate with other disciplines, about how we bring this into our own course. I know the COBie sheet will be the starting point for us. Using that spreadsheet, then bringing that into GIS. I’m not sure exactly how we will do this but I know that everything to do with BIM fluctuates every day – new ways to do things, new instructions. I think we will be running the whole time to get something up and running for our classes. If you do not think that this will affect you I would urge you think again. *Any* discipline relating to buildings, the built environment or the landscape you will be working with people like us, with engineers etc. and you will need to understand BIM.
Comment – Carl) There is an AGI special interest group on BIM. How will EDINA fit into BIM here?
A – Emma) We will have to do something, but we will need to investigate further. However if you have ideas about what we can do to help, what we need to support you, then we very much welcome them.
And over to Emma for a thank you.
Open & “Free” Geo Software and Data – Tom Armitage, EDINA
Tom will be talking about various bits of open source and free data and tools which may be of interest and of use with the tools and data we provide. We are aware that everyone’s budget is tight so hopefully all free resources are helpful. This will be an overview of what’s out there and what we recommend of these.
So, firstly, why bother with open source? You may think it’s liable to break, that it’s flakey, that it’s just for nerds… but there are key reasons you should be taking note. The quality of free tools and data is vastly improved. When you think about the data there are no restrictions which can be particularly useful off campus, for commercial use – no need to go out and learn a new GIS system if you are using the same tools that can be used for commercial purposes – or for web publishing. Demand is changing too, industry has noticed that open source is important and they want students to have skills in programmes such as Quantum GIS. And cost wise? Well it is “free” but you have to train, to maintain, to support the use. But without that payment for a licence there is a significant cost benefit.
I will be talking about OpenSource, Free and Fremium. What do these terms mean? OpenSource is free to download, use and develop. Code or raw data is available to update or augment. Free tends to be free to download and use. Code or souce material is not available. Fremium is about free to download and use but with added functionality or material available at some additional cost.
In terms of Desktop GIS the key OpenSource systems are Quantum GIS (QGIS) – you do see this on job ads – and gvSIG. In terms of free tools AutoCAD Map 3D is free for academic use (only). This is more a GIS package. There is also AutoCAD Civil. Both of those systems are PC only though. In terms of Freemium you have things like ArcGIS layer viewer – but for full GIS stuff you need to pay for the full product.
Quantum GIS is free. It’s about the only GIS that runs on Mac. There is a huge user community with very active online forums and many people developing plugins and add ons. Version 2 – launching soon – will see parity in functionality in ArcGIS. And it is the one industry are using and asking for. QGIS will work with any database (Postress, MYSQL, ODBC, Esri, etc.). And Ordnance Survey are now producing styling for their own data – they now provide Style Layer Descriptor (SLD) Files and they work with OpenSource GIS software. They are not quite as good for symbology as some of the proprietary systems but it’s really good.
Some other notable players here in the open source GIS world include gvSIG – which has excellent foreign language support. There is also a mobile version. uDig is very easy to use but limited in functionality, and it hasn’t been updated for a while. And GRASS, the original open source GIS, is increadibly powerful but command line run. However someone has created a plugin for QGIS which is a very powerful and usable combination.
If we think about Cloud based GIS there are two options here for data visualisation and sharing. Google Earth Engine and ArcGIS Online. ArcGIS online allows you to create maps online, add lots of data from ESRI Microsoft OS, upload your own data, and share your maps. In the free service all maps you create are open for anyone to view. The Paid service is included in the top level CHEST deal and at this level you can keep your uploaded data private.
Google Earth Engine works very similar. There is a little additional analysis possible via Google Fusion Tables. The premium version allows you to host this locally (which is ok for Ordnance Survey data as long as it stays offline).
Warning: Ordnance Survey do not allow their licensed data to be uploaded to cloud services, particularly MasterMap data. Even if you are creating private maps with these services.
There are also various Web Mapping options out there. These are for displaying your maps online rather than perform analysis. Some will allow editing and data creation. MapBox is a Freemium service build on Leaflet; there is Leaflet itself – it is easy to use and very light weight but not very flexible, you have to use Web Mercator projection and only used GeoJSON or Native Layers; OpenLayers is very powerful and allows you to create interactive maps, but you need to know what you are doing and write the pages yourself – but there is a big user community out there to engage with, and you can use data from any WMS including the OpenStream; MapServer similarly. To give you a sense of just how powerful OpenLayers and MapServer are, they are the backbone of the Digimap Roam service.
So moving onto Data we have several levels here as well. In terms of OpenSource Data we are really talking about OpenStreetMap. In terms of Open Data there is OS OpenData, BGS OpenGeoscience, ShareGeoOpen etc. For Freemium the data includes Bing maps etc – where the data is good but usage etc. limited.
There are pros and cons to many of these data sets. OpenStreetMap is really good – even better in urban environments. But even the gaps are becoming less and less important as the data improves. But there is a lack of consistency here when compared to licensed data. But this type of data is called for more and more all the time – the point data in OpenStreetMap is particularly useful if available in your students’ area of interest.
The OS OpenData covers multiple Ordnance Survey data sets. Indeed 8 of the 14 views in Digimap Roam use open data. Data Download makes OS OpenData easier to use. OpenStream lets you pipe it direct into your web app or GIS. It’s good data and we provide a more usable route into that data for anyone with an @…ac.uk email address.
The BGS have taken a different approach – smallest scale data is available for download with larger scale data in online viewers. And we layer that data on OS OpenStream background maps rather than Google, Bing or similar.
ShareGeoOpen is a collection of 214 Open Datasets – mainly UK based. We would really recommend you contributing or encouraging students to contribute data there for reuse – particularly useful for identifying previous work and avoiding rerunning the same project multiple times.
Geospatial data isn’t, however, all about maps. Most data has an element of geospatial data or can be georeferenced – postcodes, place name, location steamp, IP addres for instance all have a geospatial element. Unlock Places is a way to put a point or polygon to virtually any data that has a spatial element, with global coverage (though better in the UK). And Unlock text lets you dig out geospatial references within text materials.
More information. OSGeo runs the FOSS4G Conference, as well as Grass, Quantum GIS and PostGIS. GoGeo lists most major free software resources. And EloGeo at Nottingham provides learning resources for GIS tools including
Q&A
Q) Is there a button in Roam to press to let students switch just to open data?
A – Tom) Not quite but the more information or “i” button will indicate the data set and license conditions. We could probably improve how we indicate that.
A – Emma) We have also considered running a whole separate Roam just for open data but we would need a business model for that. If you think that would be useful or have any comments or ideas around that please do come and talk to us.
Q) EDINA is an institution that farms out a whole series of products. There are lots of others as 4G comes together, as these things converge? I’m quite new to this so wondering where do you see this going? Where do you see the industry going?
A – Emma) We are a Jisc funded organisation so much of what we do is aligned with their vision, and we are clear that we produce tools for academic use. So we are not as much focused on public domain/freemium products for a wider audience but actually that is a tricky question as it’s not clear exactly where everything will be converging…
A – Tom) But you will see some of that work for the current/near future in our FieldTripGB demo later.
A – Addy) ArcGIS are pushing for GIS in the cloud. Ten years ago we wouldn’t have thought of Google as key mapping providers, now they are also providing GIS in the cloud. Those players are emerging. Roam is in the cloud – which seems to where the sector is going – but we could look to doing more processing in the cloud.
Comment – Kamie Kitmitto, Mimas) We have GRASS training materials in EloGeo as well.
EDINA GeoServices Review – Emma Diffley
At the moment you will be aware that we provide Digimap, GoGeo, geodoc, ShareGeo, Digimap for Schools – literally this is Digimap for Schools, Unlock, agcensus, and the UK Data Service Census Support is the new name for the data we used to know as UK Borders.
The first bit of big news is that we will be withdrawing Digimap Carto on 31st July 2013. It was launched in 1996. We haven’t been able to keep Carto working well and, meanwhile, we have taken the best of Carto and taken it into Roam, which is much easier to use. Things like overlays, being able to print to A0, being able to print to your choice of scale. You can now do these things in Roam – in terms of scale there are some limitations but we now support most formats or you can download the data and print yourself on larger/other fomats.
We have made some enhancements to Roam – Annotations: Save, Open, Import and Export (to various formats). You now have your own maps area making them much easier to find and access what you have already created. Basemaps is another new thing. If you are familiar with the data there are various flavours of basemaps – and you can now pick between any of these that are available at a given zoom level. We have also added printing from Ancient Roam to PDF. And it is now the case that all Roams will support (currently in Ordnance Survey only) from A4 to A0.
In future for all Roams we are trying to make a cleaner interface, keeping it consistent across all Roams. There will be a convergence of look and feel across all Collections. There will be better printing controls. And there will be simpler, combined map and annotation Save/Open between Roams (e.g. accessing the same selected area). And there are additional overlay options coming soon (boundaries, contours…).
We have also made some data improvements. We have the VectorMap Local Shapefiles – we’ve converted all tiles to Shapefile and layer files for symbolisation are in production. VectorMap Local DWG will be available which will be good news to AutoCAD users. VectorMap Local is almost but not quite as detailed as MasterMap. All tiles have been converted to georeferenced DWG (with some styling) and will be available very very soon. OS MasterMap ITN will see improved performance with reduced file sizes. OS MasterMap Topo – DWG planned her soon. The DWG release will be a beta release really – we’ve done a lot of work to get this right but we are looking for feedback on these. We’ve made a first step on this though.
We’ve also been making some further tweaks to data. Strategi data has some potential for styling – with features not to be shown at smaller scale, e.g. Tourist symbols. And with the Meridean 2 and LandForm Panorama data we have done VML styling to make it more accessible and easy to use.
We have been harmonising Data Download so that all OS data is provided through one client encompassing MasterMap Download and Boundary Download (those separate downloaders have therefore been withdrawn), including all OS Open Data and Digimap Licened data. And we have the new Geology Download coming soon, more to follow.
We have also made some Help and Support Enhancements. We have a new Resource Centre, which does not require login, with answers to questions, videos, case studies etc.
On GoGeo we have added more resources and highlighting of the “Editor’s Picks”. You can search for data among 20,000 records from data providers around the world. Workshop resources introduce the importance of metadata. GoGeo also searches ShareGeo and ShareGeoOpen for data. ShareGeo Open includes over 210 resources all of which are open and free to use. You can share your data here and then cite the URI in publications, use data in projects/research/teaching contexts. That data gets used, seen, reused.
FieldTrip GB is a mobile for capturing data – you will get to try that out later!
GeoTagger is a tool to allow you to edit the metadata for your photos – which can then be useful for research or for use in sharing sites. Usually that will be about adding location data, perhaps occasionally you may want to remove that data. The idea is that you can tag images of your fieldtrip for instance.
Cartogrammar is another project, the idea is that you upload your data and it generates a different interpretation and visualisation of your data. It’s a fun thing to play with and explore your data in different ways.
UK Borders is no longer UK Borders. It is now the UK Data Service Census Support Unit. Underneath it’s the same data and code but it looks different on top. There is a link from the UK Data Service Census Support Unit website. All applications now in the UK Data Service style. Functions and data remain unchanged. Training now available via webinars. All support enquiries to go via online enquiry page – those eventually come to us but mean the UK Data Services are able to track those requests and support. There are some aspects of the Census programme as a whole are still in flux but that UK Borders data is still there for now.
So, what’s on the horizon? Well we are still awaiting news on funding. There are still lots of things we would like to do. If there are things you would like us to do we really want to hear about them as your recommendations carry real weight for us. And we are keen to hear our ideas on new data. We are looking to “mobilise” more. And we will be continuing to add new support materials.
Q&A
Q – Shelley) Can you say a big more about agcensus
A) It’s actually one of our oldest services. It provides agricultural census data – things like number of sheep, cowd, grain etc. It’s simple data but useful. It comes from
Q – Shelley) Could you use this for teaching animal management – how many sheep on a chalk bank in a particular area for instance?
A – Tom) It would be amount of meat harvested per square metre. Would that be appropriate? And there is a long history of this type of data, and long term data.
A – Shelley) That would be useful, particularly for comparing rural agricultural yields with urban yields for instance.
Comment – Emma) It is a subscription service. There is an institutional price or there are variations – institutions, personal, project and one-time subscriptions are available.
Q – Shelley) Can you say a bit more about bringing in environment data in Digimap?
A) We have undertook to include land cover data into our services. But the financial landscape changed since we took that decision. The data is ready to go but we are waiting for an official go ahead for releasing that.
A – Shelley) It’s data that we need in our work and our department for sure so we’d love to see that in there.
Comment – Tom) I’d love to hear more about the printing interface – what you and your students might like to see. Should it show less? Should it show more? It’s so hard to get right. That preview needs to look like what will be printed – but it can’t be perfectly the same so what makes the most sense and is most usable?
Comment – Emma) We need area, paper size and scale to all feed in here. There are limitations between those factors. People want to see exactly the area at the sane scale – but you can’t get A0 full size on a screen. You can’t show the extent and scale on the same image. We did think about tabs for different views but that’s not ideal either. Really you cannot have a WYSIWYG interface – you will get what you request but we can’t display it in the preview appropriately.
Comment) On most print previews you see the relationship between the preview and the page – can you do that?
A – Tom) The thing is there is no way to do that correctly unless you generate the PDF – which will take the same amount of time to generate the preview as to generate a PDF. But there’s no limit to how many PDFs you can create!
A – Emma) We have an issue with Digimap and Digimap for Schools both here – a nervousness that PDF is the same as “print”, people reluctant to generate PDFs. But we need to think about that.
Comment) How about just generating the PDF and showing that as the preview
A – Tom) That would be great but presupposes the user has Adobe Acrobat
Q) Is there anyway to make that connection between Roam and Data Download for OS Maps seamless?
A – Emma) The way that data download works is much more like that. We are not quite there yet but getting there.
Comment) When you purchase a map it appears to work in that way – it appears to work in that way, you click the picture and order the DWG.
A – Tom) We did wonder if providing DWG as a print format might be appropriate. They are things we are considering.
Q – Kami) How do you think about things like WMS rather than data download? Instead of download the accessing the data over the web via your GIS or tool. This is the general trend of Google, ESRI, etc. Probably makes sense to move towards that. And some industries may value those skills.
Comment – Shelley) I think that would be a lot easier actually.
A – Emma) We do have OpenStream… Data providers like this format and there is a move towards streaming data rather than downloads. We are working on this stuff.
FieldTrip GB Excursion – led by Addy Pope
This will be a slightly briefer live blog section as this is a hands on session trialling FieldTrip GB across the streets of Bloomsbury. Pictures illustrating the session will follow however.
Today we will be using FieldTrip GB to collect data and then we will come back here and visualise this data.
FieldTrip GB lets you collect georeferenced data – whether you have a data connection or whether you are somewhere remote where you will not be able to upload data until you return. FieldTrip GB works with a DropBox account to allow you to upload and share data. The mapping used is OS OpenData, OpenStreetMaps, and other open sources data all combined together, optimised for 4 inch screen and with rural coverage carefully considered. There is one mapping stack to make things easy and friendly across disciplines. This was a challenge as detail in urban and rural areas varies. But we have used Mapserver 6.2 Masking. It works brilliantly except when you are on a boundary between areas. It works well for most people but it’s unfortunate if your mapping area is always on the boundaries of those maps.
You can select an area and download data ahead of a fieldtrip. At the moment there is a limit of 3 x 15MB downloads – enough data for most of the greater London area or the whole of the Lake District. We are open to suggestions there though.
We have also created an authoring tool – here you can create your own forms for data collection which allow you to set up fields, mandatory or optional, you can provide hints for filling in those forms. The idea is that the forms should minimise effort in the field. You can collect data, use scales, include images etc. There are many options. And once your data is collected you can synch to Dropbox, you can use it, you can export it, and you can work on it.
So, for the complicated part. I will author a form, you will log into it, you will collect data, we will come back and visualise that data on Google Earth. It worked with the last group so fingers crossed. The last group collected pictures of bicycles – which was quite easy – what should we look at? Suggestion: Buildings and number of floors in said buildings. We will do that as a range, which will be a drop down box. And we can gather building fabric – a multi choice selector. And we will include an image capture.
So I have saved that. And that had synched to my dropbox account. So you will log in to that account and be able to access that form… and that having been done we shall head outside…
[cue a short excursion across Bloomsbury]
So, basically, that’s everything you need to do. The files just get synched to Dropbox. Then there is a record viewer in the Authoring tool. You can view the records, you can tweak the records, you can make any changes or corrections required here. You could change the picture – to a better angle for instance – but that’s trickier. It is probably better to create the extra point and delete the old one. The next thing to do is export our data. We will export as KML. And then just load it into Google Earth. You can then view the data and images.
So, in half an hour we have installed the app, used the app, edited the data and visualised the data. That’s not bad.
Q&A
Q) Does the date and time stamp carry with those records?
A) Yes, it is captured but we could expose that better.
Q) Is it UK only?
A) At the moment it is but we want to make it work globally but the issue is how best to do that. But we are considering Overlays which would let you connect up that mapping. But we wanted it to mirror the scope of Digimap – hence FieldTrip GB.
Closing Remarks – Emma Diffley, EDINA
Thank you so much for coming along, we know it’s a long way for some of you. We had some really interesting ideas from Shelley and her colleagues – we learned the phrase “BIM-ed up”. And myself and my colleagues really appreciated the opportunity to talk to you all during lunch time, to find out what you are doing. And I know we bang on about feedback but your feedback and comments are the best evidence to support and justify our existence. We really do appreciate that feedback.
And that’s #geoforum2013 finished. Huge thanks to all who came along in person and all who have been following online. We really appreciate your time and input.
Highlights of this year’s event include a fascinating key note speaker in Shelley Mosco, who will be showing us how Digimap data is used in landscape architecture. Shelley will also explaining how our data can be used for Building Information Management (BIM) as this is becoming a compulsory regulation in the construction industry.
We will be taking you outside to show you the new FieldtripGB app, so don’t forget your smart phone if you have one. We think that you and your students will find this a very valuable resource for the collection of data in the field.
There will be a sneak preview of the important changes that are happening to the Roam interfaces over the summer. The Roams are having some great new features added and a new easier to use layout, don’t miss out on this chance to get a first look.
There will also be an overview on what OpenSource GIS and OpenData resources you should be looking at for teaching and research. These resources are becoming increasingly important, and requests for assistance from the EDINA help desk are on the rise.
All the details including the booking form can be found here:
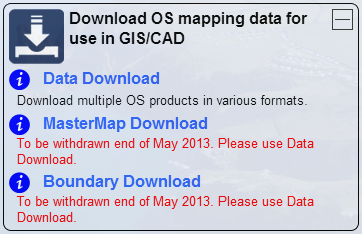
Both MasterMap Download and Boundary Download have been withdrawn today 28th May 2013.
The functionality and datasets offered by MasterMap Download and Boundary Download are now available through the standard Data Download application. This can be found in the Download OS mapping data section of Digimap’s Ordnance Survey Collection.
Please let us know if you have any questions or concerns about this or anything else:
Our Keynote speaker at Geoforum this year is Shelley Mosco.
Shelley is a practising landscape architect and senior lecturer in GIS at the University of Greenwich in the School of Architecture, Design and Construction. She is also involved in research of living walls and green roofs as part of the school’s Sustainable Landscapes Research Group.
Along with Jade Goto, Shelley won Bronze at Chelsea Flower show for their QR Code Garden.
Shelley’s talk is titled “Digimap Data and a Non-traditionalist Perspective” and will provide us with an insight into the use of Digimap Data in a subject quite different from the traditional geographical disciplines.
Places at Geoforum 2013 are filling up; there are more details on the website including the booking form:


 EDINA’s Geoforum 2013 was a great success with over 50 academic and support staff attending four very well received presentations: