Any views expressed within media held on this service are those of the contributors, should not be taken as approved or endorsed by the University, and do not necessarily reflect the views of the University in respect of any particular issue.
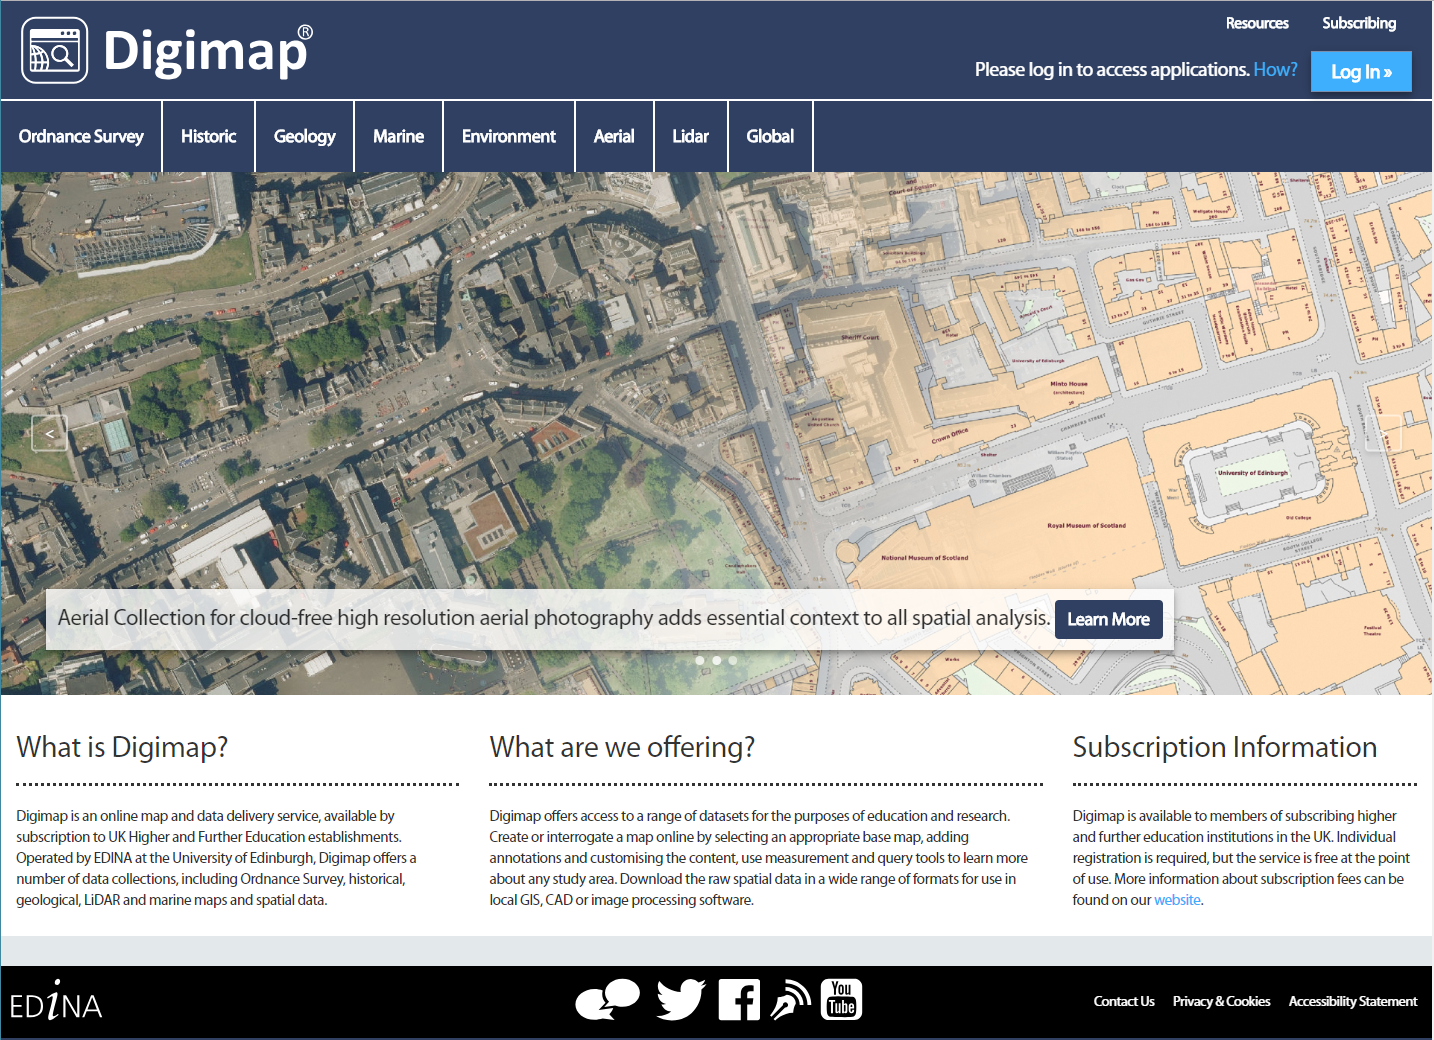
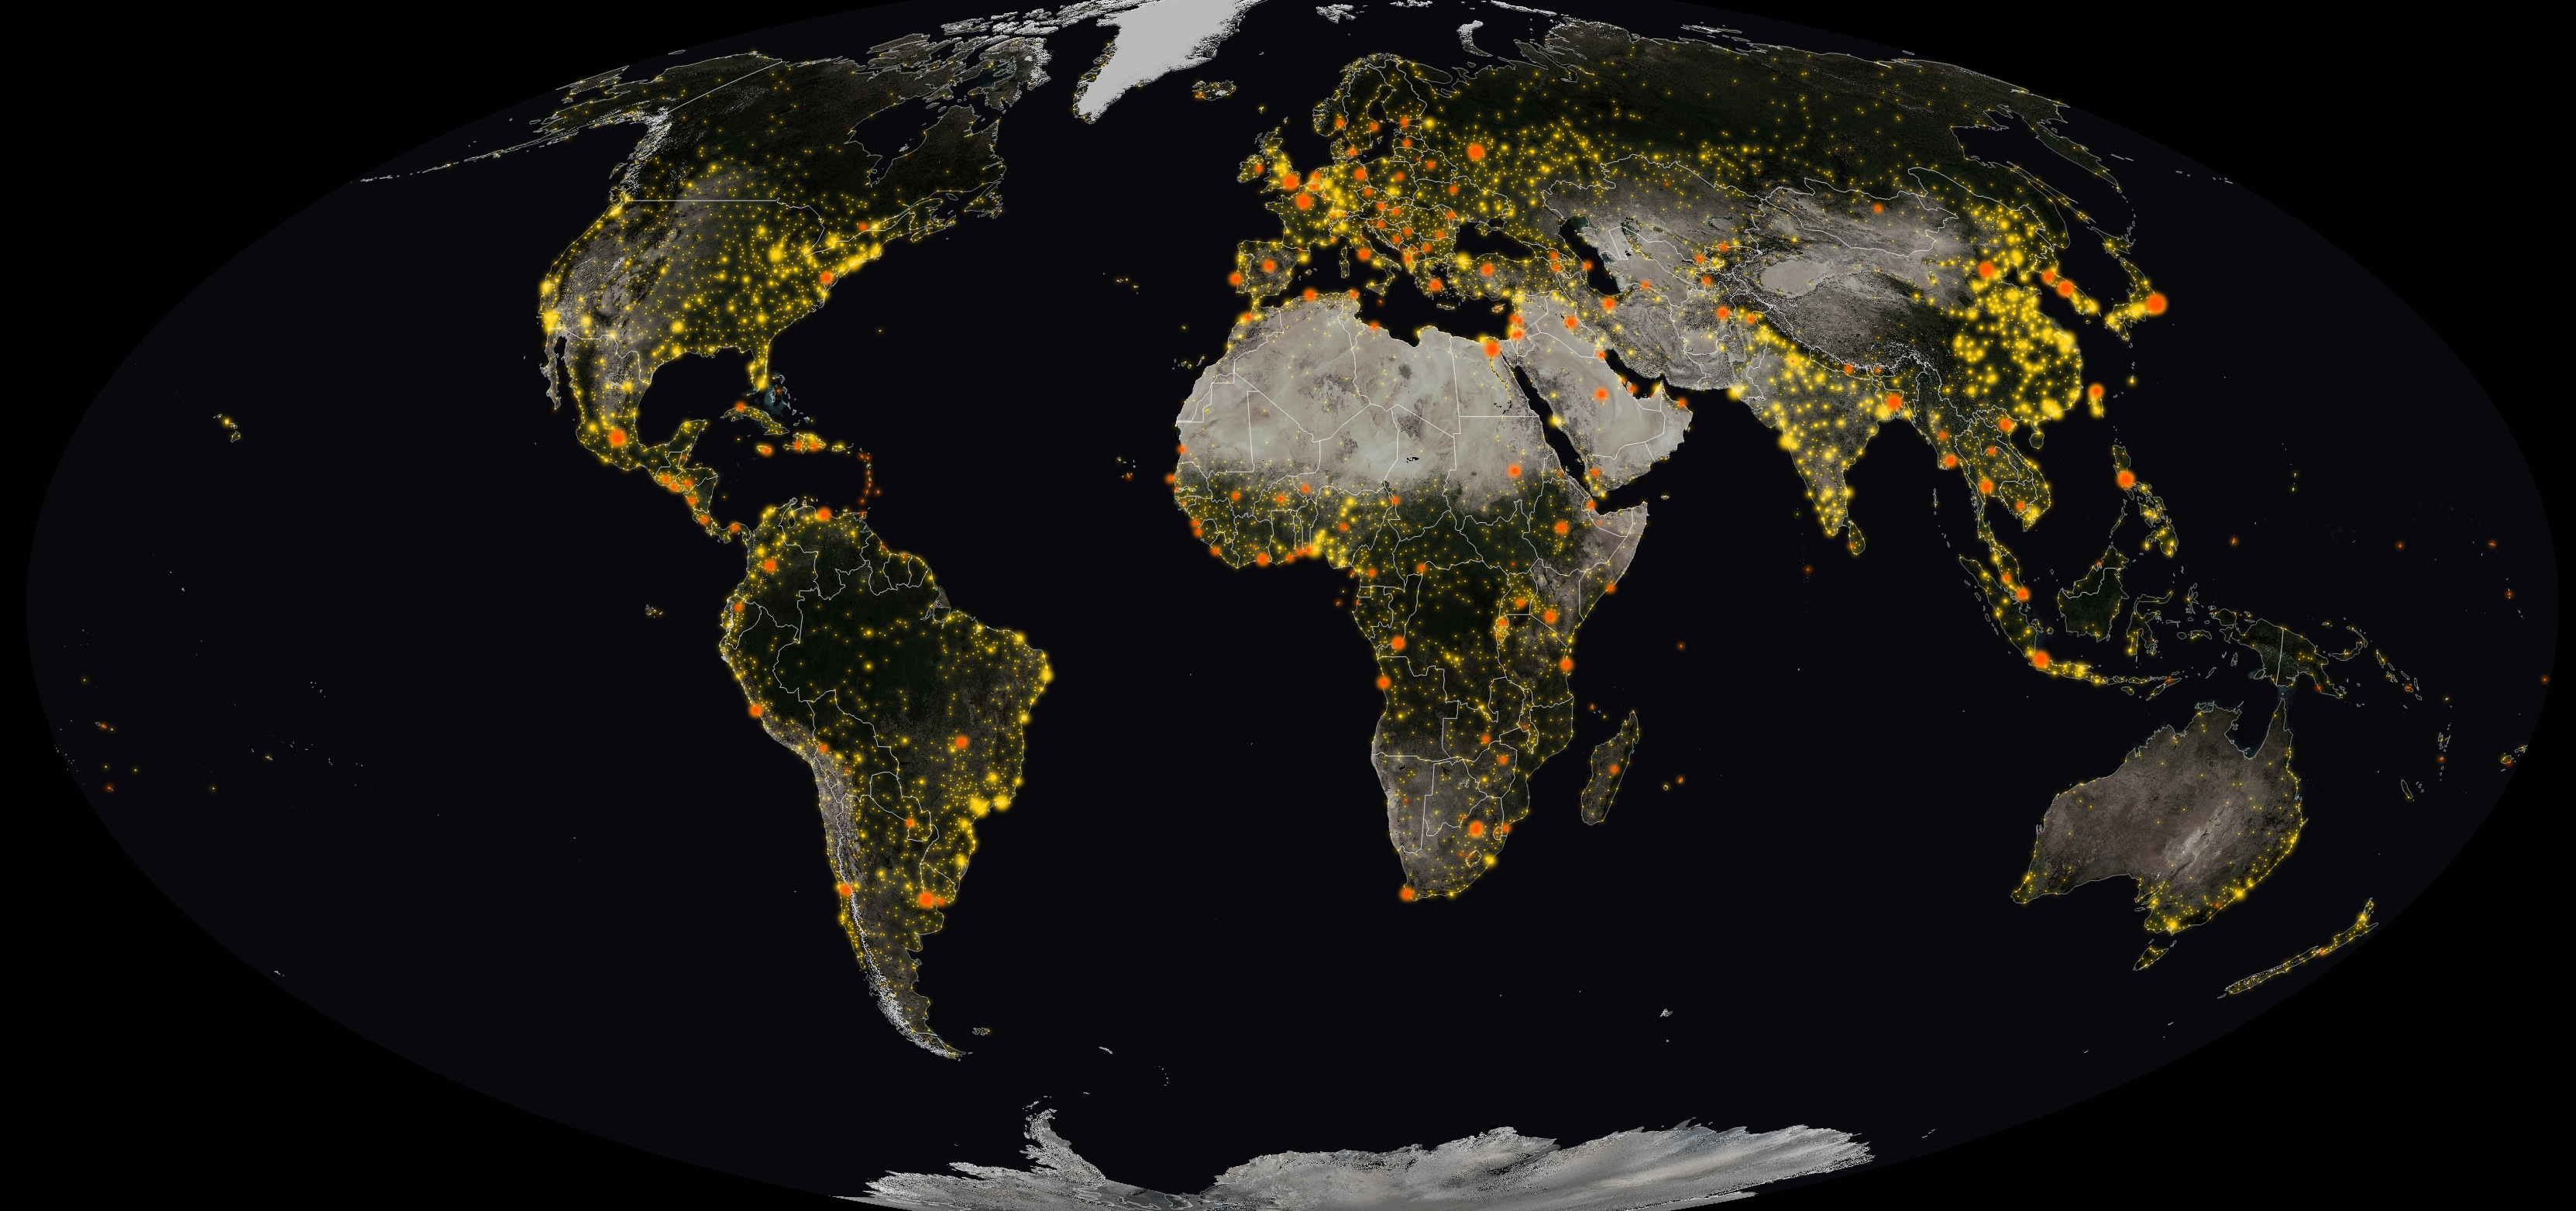
Digimap is an online map and data delivery service, available by subscription to UK Higher and Further Education establishments. Operated by EDINA at the University of Edinburgh, Digimap offers a number of data collections, including Ordnance Survey, historical, geological, aerial photography, LiDAR, marine maps, land cover mapping, global mapping and census data. For more information about Digimap go to our website: https://digimap.edina.ac.uk Background image Contains OS data (c) Crown Copyright and database right 2022
The session, “Data Standards and Q-FAIR — A view from Ordnance Survey,” will explore how Q-FAIR principles can help target data standards interventions, and why metadata and addressing standards are so important for discoverability and interoperability.
Allan Jamieson from Ordnance Survey will also introduce the National Geospatial Data Standards Register and discuss current and future efforts in data standardisation across the UK and internationally.
This webinar will be of interest to data scientists, researchers, GIS professionals, educators, and anyone working with geospatial or linked datasets. Whether you are combining data from different sources and time periods or simply want to learn more about standards and formats that support effective data use.
We have some exciting updates to share for the start of the new academic year:
Society Digimap: New Census Data Available
We’ve refreshed the interface and added the most recent census data: Scotland (2022) and England & Wales (2021). This provides richer demographic and societal information for your projects and research.
Global Digimap: Updated Maps and Data
We have switched our global mapping provider from OpenStreetMap to Overture Maps. Overture is based on OpenStreetMap but is enriched with data from other sources. This means you’ll benefit from the very best open-source mapping, with a smoother user experience and data updated to March 2025.The data will be also available for download.
OS Data: New and Updated Datasets
We’ve added the new Multimodal Routing Network (MRN) data to the OS Collection, ideal for users needing detailed transport and routing information. This includes the speed data previously available under trial from Basemap.Ordnance Survey National Geographic Database (OS NGD) data has been updated to the May 2025 version, also available in the OS Collection.All other products continue to be updated according to their usual schedules.
Trials: Map Impact environmental risks data
Data from Map Impact is available for trial and testing in Pilot Digimap until December 2025. Go to Pilot Digimap >> Data Download tab >> Map Impact to download samples. The data available relates to Biodiversity, Drought Risk, Wildfire Risk, and Heat Risk. It is supplied as H3 hex grids on WGS84 (EPSG:4326) projection
Environment Digimap: LandCoverMap 2024 data now available
The latest version of the LandCoverMap for 2024 from UKCEH is now available for download in Environment Digimap. We are working on making this available for mapping too, and hope to have this available soon.
Marine Digimap: New Shipping Forecast overlay available
Celebrating 100 years or broadcast this year, the Shipping Forecast has not only saved lives and grown as an important safety tool, but it’s also established itself as a cultural staple in UK and Republic of Ireland. Now these forecast areas can be added to maps in Marine Digimap, adding context and illustration for further research work.
Ordnance Survey data: withdrawal of OSMM Water Network announced
OS continually develop their product range and as part of this process some products are “retired” and no longer updated or made available. Digimap maintains a historical archive of data previously licensed from OS, which enables continuity of supply for research purposes. The following products have been given a withdrawal date:
OS MasterMap Water Network Layer will be withdrawn on 31 March 2026
This will be superseded by the NGD Water Theme – Water Collection, which already exists and is available through Digimap (your institution will need to purchase a subscription to the OS NGD data). You can read the withdrawal notice on Ordnance Survey’s website.
Action Required: Licence re-agreements
All Digimap licences expired on 31 July 2025. To continue accessing Digimap you must re-agree to the licences for the collections and products your institution subscribes to from 1 August 2025.
Please note your institution may not have renewed every subscription it held for 2024/25. To re-agree to the licences, please log in to Digimap as usual and follow the prompts. Help with this is available on the help page about accepting licence terms . There are no substantive changes to the licences between last year and this.
Digimap Webinars: October 2025
We are hosting the following webinars in October 2025. For more information/to register, please visit our blog by clicking the button below.
8 October 2025, 13:00 BST. Verisk Land and Buildings data for the UK – Exploring Verisk land and property data in Digimap. Presented by Jeremy Thomas, Business Development Consultant and Tom Timms, Sales Director at Verisk.
9 October 2025, 13:00 BST. Historical Map Products in Digimap. Presented by Giles Martin, Head of Data Sales at Landmark Information Group.
If you would like to receive updates like this by email, please log in to Digimap and go to Change User Details from the My Digimap link (top right hand corner). You can leave your details the same, but check the box to say you’d like to hear from us!
Transform Your GIS Projects with 3D Visualizations Using ArcGIS Pro and Digimap Data
Ready to bring your GIS projects to life in 3D? In this in-depth tutorial, Ian Holmes, Geo-Data User Support Officer at EDINA, shows you how to harness the power of ArcGIS Pro alongside rich, detailed datasets from Digimap to create stunning 3D scenes.
In this step-by-step guide, you’ll learn how to:
Incorporate aerial imagery into your 3D scene.
Use geological data and OS Terrain 5 to create detailed visualizations.
Visualize building heights and other key attributes with OS Mastermap and UK Buildings data.
Add National Tree Map data for an extra layer of detail.
Export your 3D scene as an animated movie.
Whether you’re a beginner looking to explore the power of ArcGIS Pro, a student eager to improve your 3D mapping skills, or a professional creating realistic visualizations, this tutorial has something for you!
To watch the tutorial now on YouTube, click below:
Discover how ArcGIS Pro and Digimap can transform your projects into stunning 3D experiences! Don’t forget to like, comment, and share the video to inspire others.
Webinar: A Walk Through Digimap Services
Join us for “A Walk Through Digimap Services”— a free, live webinar introducing you to Digimap’s powerful tools and features. This session will cover from an overview of map collections and navigating the platform to how to select and download your data. A live Q&A will follow to answer all your questions.
TWO WEEK REMINDER – SUBMISSION OF ABSTRACTS deadline extended until Monday 15th February 2021
We are pleased to invite you to submit a 1500 word extended abstract for the 29th Annual GIS Research UK (GISRUK) Conference, which will take place as a fully online event from Tuesday 13th April to Friday 16th April 2021. The whole conference will be fully open and free (£0) and is hosted by Cardiff University. Please see conference website for details:
All Digimap users currently have free access to Global Digimap until 31st July 2019 as a trial. We hope you like this new service. If you would like to learn more about the OpenStreetMap data, it’s origins and history, from someone who is more than qualified to tell the story, Steve Chilton is giving a talk at #geomob in London on 19th June 2019 about this very subject.
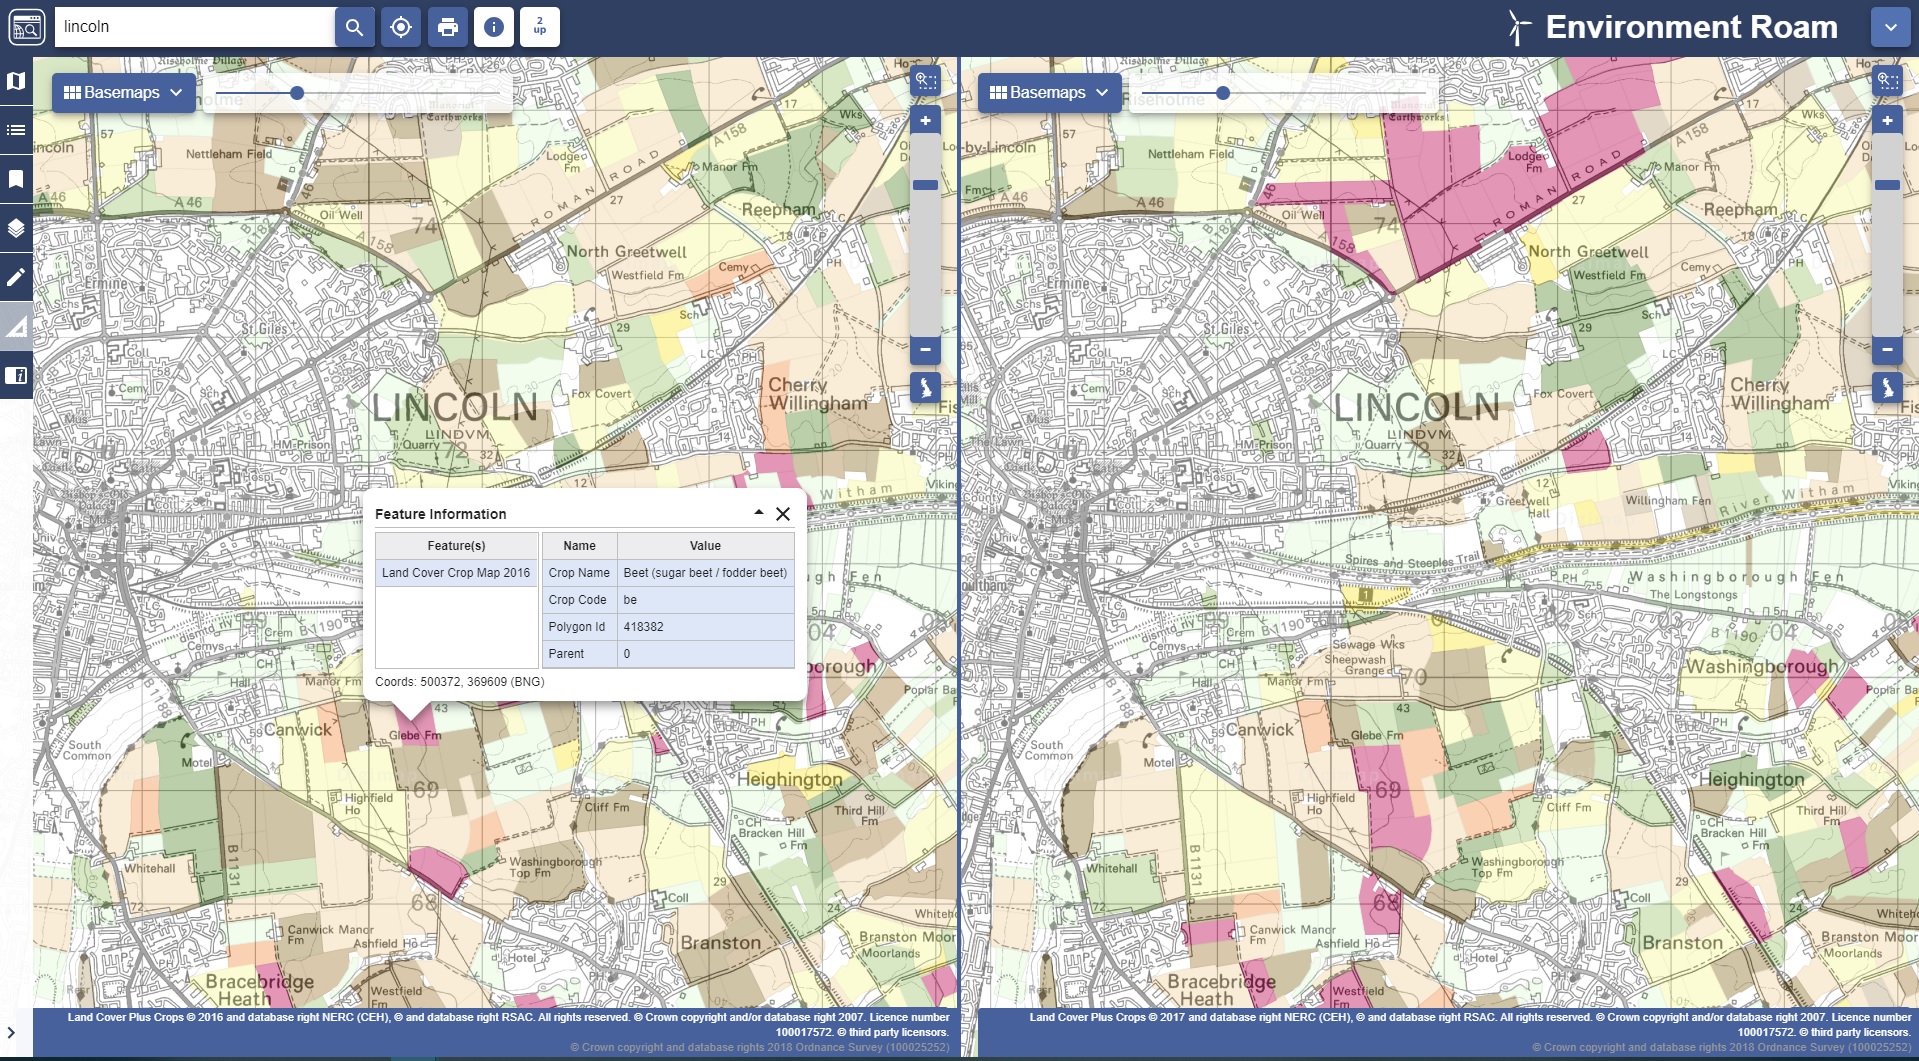
We are delighted to announce that Environment Digimap now offers the CEH Land Cover® Plus: Crops dataset. CEH Land Cover® Plus: Crops has been produced by the Centre for Ecology & Hydrology in partnership with Remote Sensing Applications Consultants and provides annually updated arable crop information for the whole of Great Britain.
Environment Digimap is the only platform dedicated to the academic sector offering this data. CEH Land Cover® Plus: Crops data is available for both 2016 and 2017. Environment Digimap’s Roam application has the new datasets displayed as alternative basemaps, allowing you to compare the two years side by side using the “2-up” map function. The opacity slider also enables the underlying context map to be viewed easily.
The Info Tool also enables you to query the Crops data, giving information about the crop name, code, the polygon identifier and the coordinates of the point chosen. All other functions in Roam operate as usual, including the ability to annotate measure and print. The Map Content is also available in the left hand panel to help you identify crop types.
The CEH Land Cover® Plus: Crops data is also available to download from Environment Download. Select your area of interest as usual, add the Crop data to your basket and select from File Geodatabase or GeoPackage as optional formats. You can also choose to select individual crop layers rather than the full suite if you wish.
If your institution has a subscription to Environment Digimap, this dataset is available at no additional charge. If your institution does not have a subscription to Environment Digimap, prices and details of the subscription process can be found on our website.*
*Please note that in order to place a subscription order you must be a suitably authorised member of staff. If you have any questions about this, please don’t hesitate to contact us.
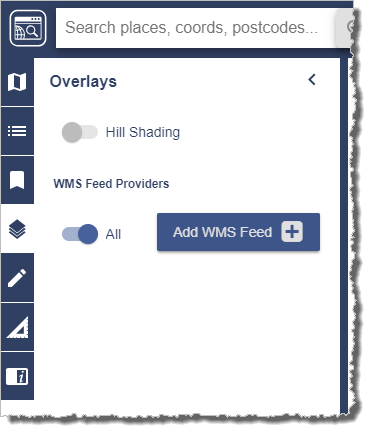
We are very pleased to announce that we we recently added WMS (Web Map Service) functionality to all Digimap Roam applications. This new facility allows you to pull in map data from a whole host of publicly accessible services allowing you to visualise a wealth of data in the familiar Digimap Roam interface. This is beta functionality, and there are a few areas that need further improvement but we were keen to get it out there as quickly as possible so that you could start making use of it. Whilst we continue to work on the functionality, we welcome any feedback you may have. Our contact details can be found at the bottom of this post.
The WMS functionality can be found in the Overlays menu panel on the left hand side:
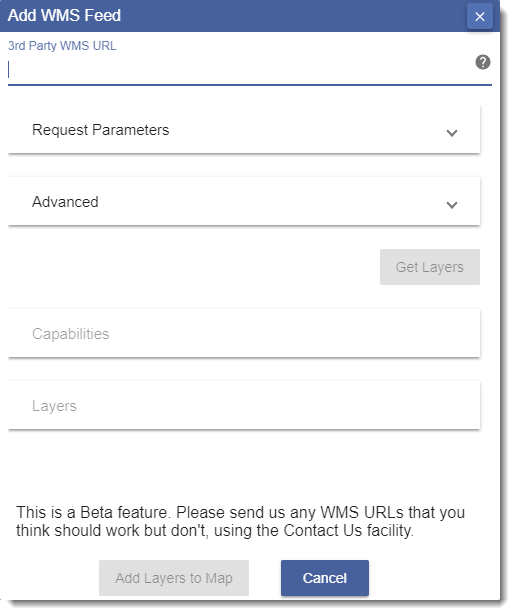
To add a WMS feed to your map you need to press the Add WMS Feed button, which will bring up the following window:
You will need to paste the getCapabilities URL in to the ‘3rd Party WMS URL’ field at the top of the popup. This URL is usually in the following format, but may be different depending on the service:
Having entered the URL the Get Layers button should become active, press this to retrieve all the layers available via the entered WMS URL. Finally add the layers to your map using the Add Layers to Map button to add them to your current map window. You can then control the opacity of each layer using the appropriate opacity slider and the order they are displayed by clicking and dragging. It’s possible to edit the names displayed e.g. to choose shorter names that are easier to see by pressing the edit button next to each entry:
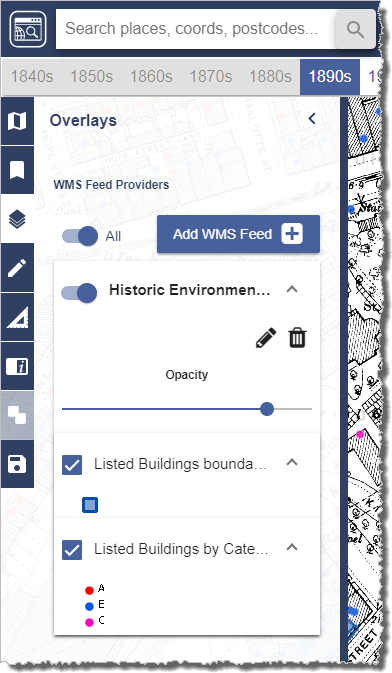
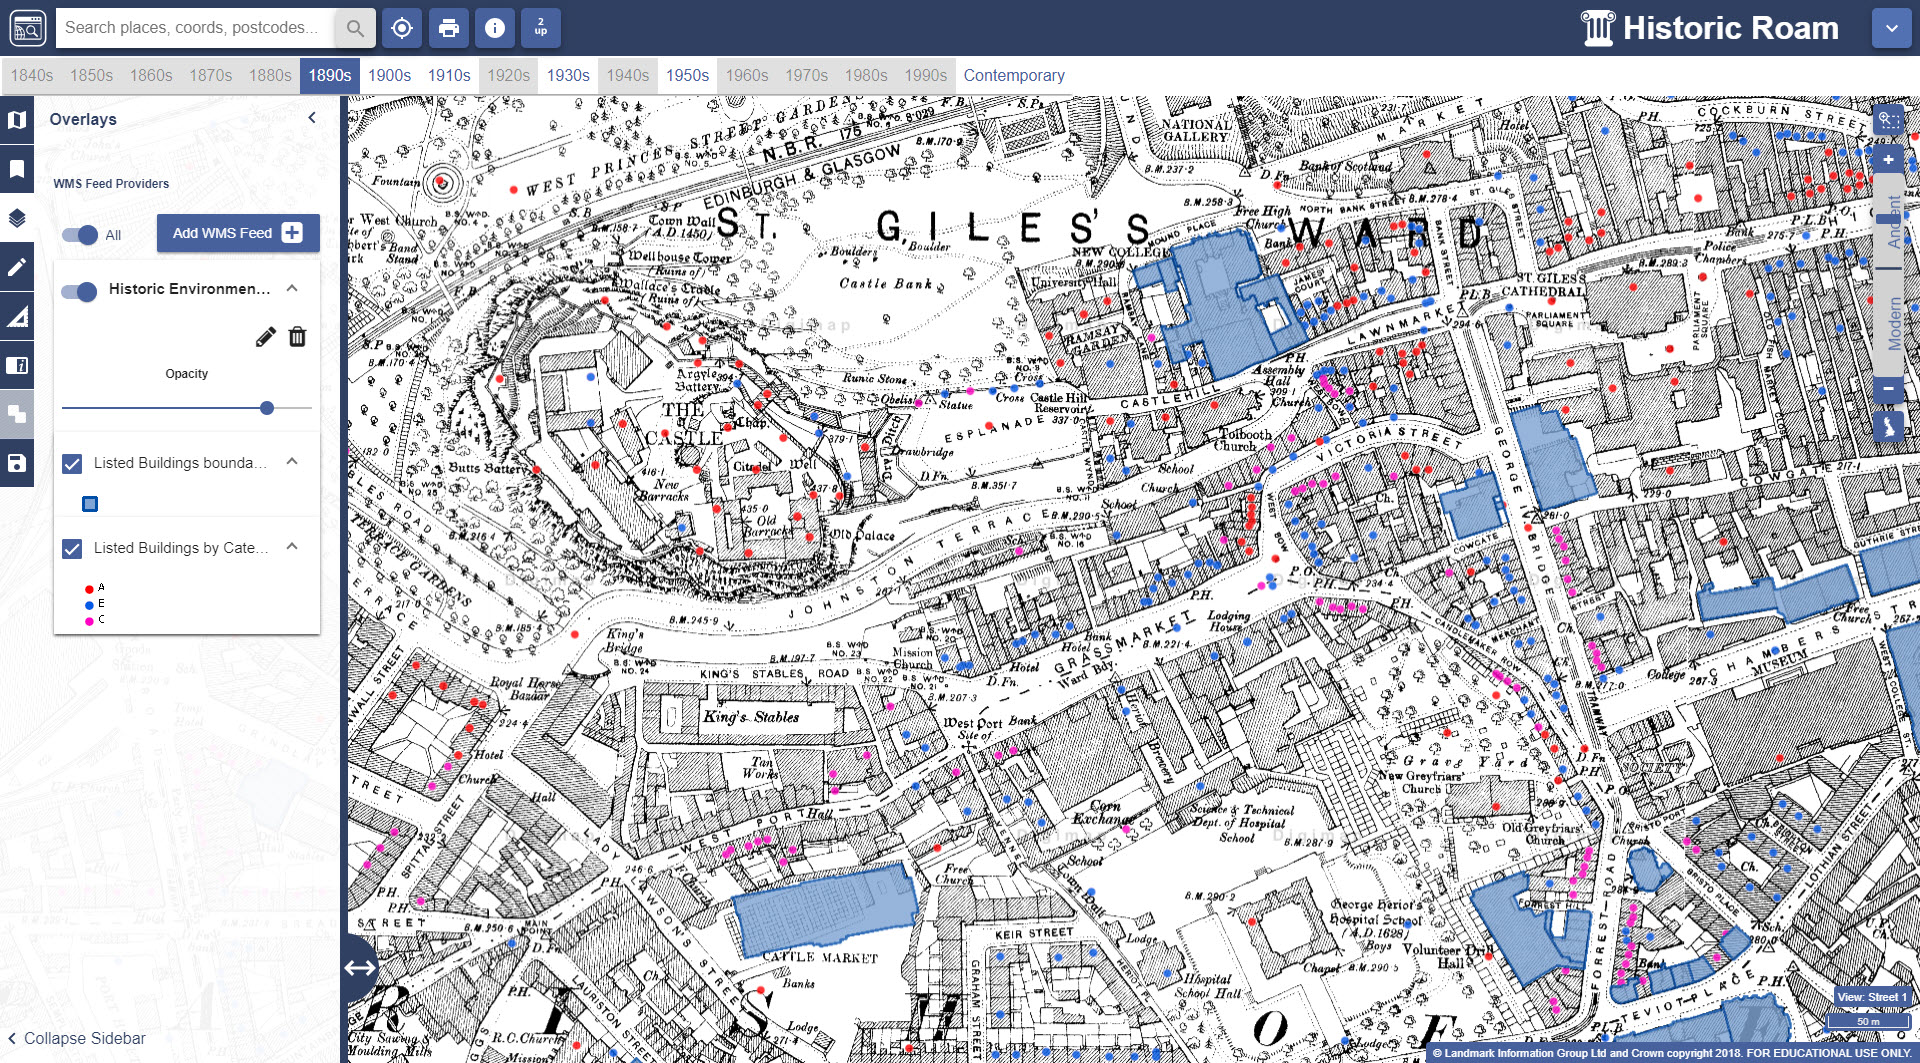
There are numerous WMS available for the UK, many of which are listed on data.gov.uk. The image below shows listed buildings (boundaries and category) published by Historic Environment Scotland on top of the 1st Edition 1:2500 County Series map published in 1896 in Ancient Roam:
Listed buildings pulled via WMS on top of historic map from 1896 in Historic Roam
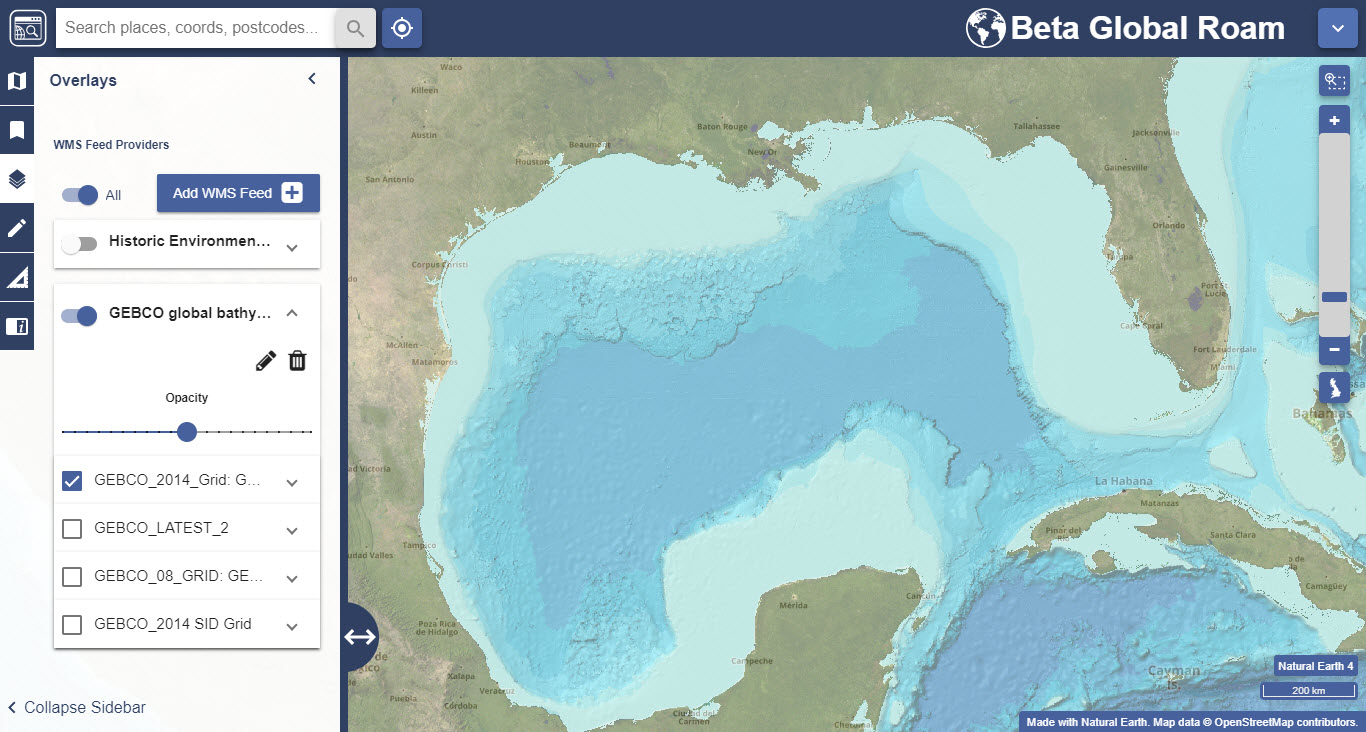
There are also lots of WMS available that serve up global data and can be viewed using the latest Global Digimap collection. One example of this is the General Bathymetric Chart of the Oceans (GEBCO), shown below in Global Roam centred on the Gulf of Mexico:
Bathymetric data via WMS on top of OpenStreetMap data in Global Roam
We have put together a help page which lists examples of a variety of WMS from different sources. Whilst we can’t guarantee that they will all work all of the time if you do come across a WMS that you think should work and have tested that it works in other software, such as QGIS or ArcGIS Online, please let us know so we can improve the service.
Known issues
As mentioned above, this is new betafunctionality and as such there are a number of known issues and things to bear in mind:
Currently no warning messages are displayed if a WMS fails to load. If the data has not appeared after a reasonable period of time please try to access the data via the same URL in QGIS or ArcGIS Online. If the data does load in QGIS or ArcGIS Online please send the URL to us so we can investigate.
In some cases the Get Layers button will not return any layers. When this happens it is worth copying and pasting the text displayed if you visit the getCapabilities URL in a browser window in to the Advanced box.
WMS data is not included in print files.
It is not currently possible to edit the details of a WMS service or dataset names in IE11 as the wrapping in the edit window is not quite correct.
Some WMS URLs (including those published by the Environment Agency) are published with the HTTP prefix but in order for these to work in Digimap Roam you need to change the prefix to HTTPS instead.
The WMS must be able to supply data in the same projection of the current Roam application. All Roam applications use the British National Grid with the exception of Chart Roam and Global Roam which both use WGS84 Web Mercator. No warning is given if the WMS projection is not compatible with the current Roam application.
WMS entries in the Overlays panel are persistent between log-ins in the same browser, so if you add a WMS in Chrome, the same WMS entries will be available the following day in Chrome providing the browser cache/temporary storage has not been cleared overnight.
WMS entries added in one Roam application are also automatically available in all other Roam applications e.g. if you add a WMS in OS Roam it will also be available in Historic Roam etc.
There is no Get Feature information displayed for a WMS layer so you cannot click on a feature and get its attribute information. However the Legend for the layer is displayed in the WMS panel if you expand the layer.
Get in touch
If you have any questions or comments about the new functionality please do not hesitate to get in touch; our contact details are below:
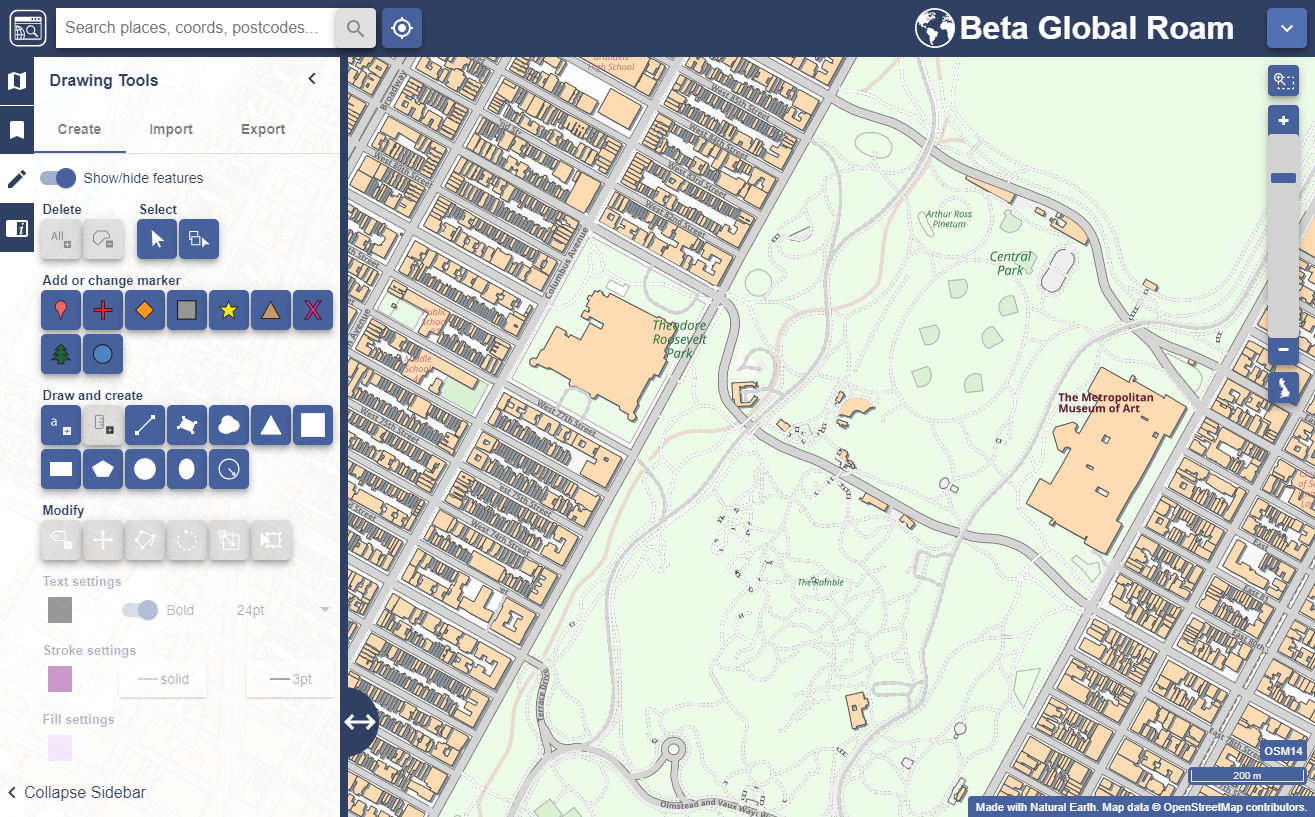
We are very pleased to announce the release of Global Roam. This builds on the release of Global Download last week and allows users to browse global data in the familiar, user friendly, Roam online mapping interface. Global Roam is very much a work in progress and you will find that some of the standard functions are not yet available, but we were keen to get something out to users as soon as possible and we’d love to know what you think of it and where you think it can be improved.
Global Roam showing Central Park in Manhattan
As mentioned in our previous blog post, Global Digimap is available as a beta service as we look to build a suite of datasets, themes and formats that best meets the needs of our users. We will continue to develop the Global Digimap service over the coming months, shaped by the feedback that you give.
Global Roam delivers the familiar Roam interface with detailed global data sourced from Natural Earth and OpenStreetMap. The application includes the usual annotation tools (recently renamed ‘drawing tools’) along with global search functionality. The most zoomed out maps use Natural Earth data which changes to OpenStreetMap as you zoom in. Future plans include:
adding additional data from the rich OpenStreetMap dataset including point features
integrating the print interface to allow high quality printed maps up to A0
addition of the feature information tool allowing users to view the attributes of selected features
creating alternative grey-scale and colour basemap styles
inclusion of the measurement tools [update: these were added 30/08/2018]
customisation of the map through the Map Content panel
It’s worth mentioning that maps saved in Global Roam are not compatible with other Roam clients and vice versa as they use a different projection system. [update: this was resolved 30/08/2018]
Access to Global Digimap
During this development phase, and in return for engagement with the development process, the service will be free of charge for institutions that subscribe to another Digimap Collection. We would like to know what you like and don’t like about it, what features and what new data you would like to see added. We can’t promise to include everything but the more we hear from you the better able we are to prioritise different requirements and create the best possible service.
If you would like access to Global Digimap please ask your local Digimap Site Representative to request access through the Digimap helpdesk and we will ensure your institution is switched on.
Get in touch
It is never too early to let us know what else you would like to see, we are very keen to hear your ideas of how we can make something really useful; our contact details are below:
It is the start of a new academic year and we have introduced few new things for you to see in Digimap:
A New Home Page
Digimap has a new home page! It may look a little different, but it works in exactly the same way as the previous version. Responding to feedback from the community we have provided more detail about each collection in the left hand panel, including preview images of the data. Roam and Data Download are easy to find under each Collection’s tab.
Global Digimap
We are very proud to announce the launch of our new Global Digimap collection. This is a new service, developed in response to requests for international data. Initially Global Digimap will offer OpenStreetMap data but our objective is to develop the collection in partnership with the user community, so user feedback will shape both the content and functionality. In return for this engagement, access to Global Digimap will be free of charge until July 2019.
We have asked all the Digimap Site Reps if they would like access to the service, if you can’t access Global Download then speak to your site rep about getting your institution switched on: List of Digimap Site Reps
Following a lengthy beta phase, we have promoted the beta version of Data Download to a production service and this is now the default Data Download application for all Collections. Ever mindful that work flows, and teaching and promotion materials may need updating as a result, we will continue to run the previous versions of both Roam and Data Download until the end of the year. All saved maps and data download histories are available in both new and old versions.
New Licences
Digimap is now operating under new licences for 2018/19 so all registered users are required to accept the new terms. This is a simple process which happens when you first log in. No re-registration is required and all saved maps and data download histories remain available as before.