Any views expressed within media held on this service are those of the contributors, should not be taken as approved or endorsed by the University, and do not necessarily reflect the views of the University in respect of any particular issue.
Digimap is an online map and data delivery service, available by subscription to UK Higher and Further Education establishments. Operated by EDINA at the University of Edinburgh, Digimap offers a number of data collections, including Ordnance Survey, historical, geological, aerial photography, LiDAR, marine maps, land cover mapping, global mapping and census data. For more information about Digimap go to our website: https://digimap.edina.ac.uk Background image Contains OS data (c) Crown Copyright and database right 2022
Geologists and others with an interest in Hutton’s Unconformity might be interested in a statement by The Geological Society regarding a proposal to construct a pump house and pipeline 150m to the east of the SSSI area at Siccar Point:
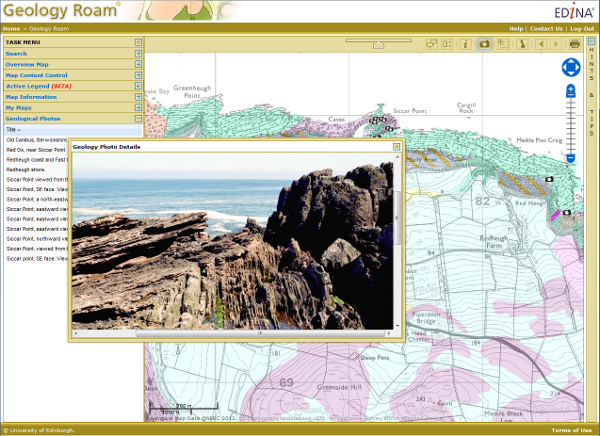
You can see some photographs of Hutton’s Unconformity at Siccar Point by logging in to Geology Roam and searching for “Siccar Point”. Zoom in to the largest scale map and click on the Geological Photos button above the top right hand corner of the map. Then click on the camera icons on the map to see each photograph.
Geology Roam showing photo of Siccar Point, the location of Hutton’s Unconformity
First, a clarification: the GML format of VectorMap Local data is not the same as the GML format of OS MasterMap data. To convert OS MasterMap GML data, use InterpOSe for Digimap by Dotted Eyes. Although the file format appears the same, InterpOSe cannot convert the GML format of VectorMap Local.
Second, the steps that follow are for 32-bit PC users only. After testing we found that the steps do not work for AutoCAD for Mac OS X. Further, AutoCAD Map 3D and AutoCAD Civil 3D are as yet unavailable for Mac OS X. If you are a Mac user, we suggest that you install a virtual PC on your Mac to run AutoCAD or contact us directly for help.
Third, we would advise you to upgrade to the latest version of AutoCAD if you are able.
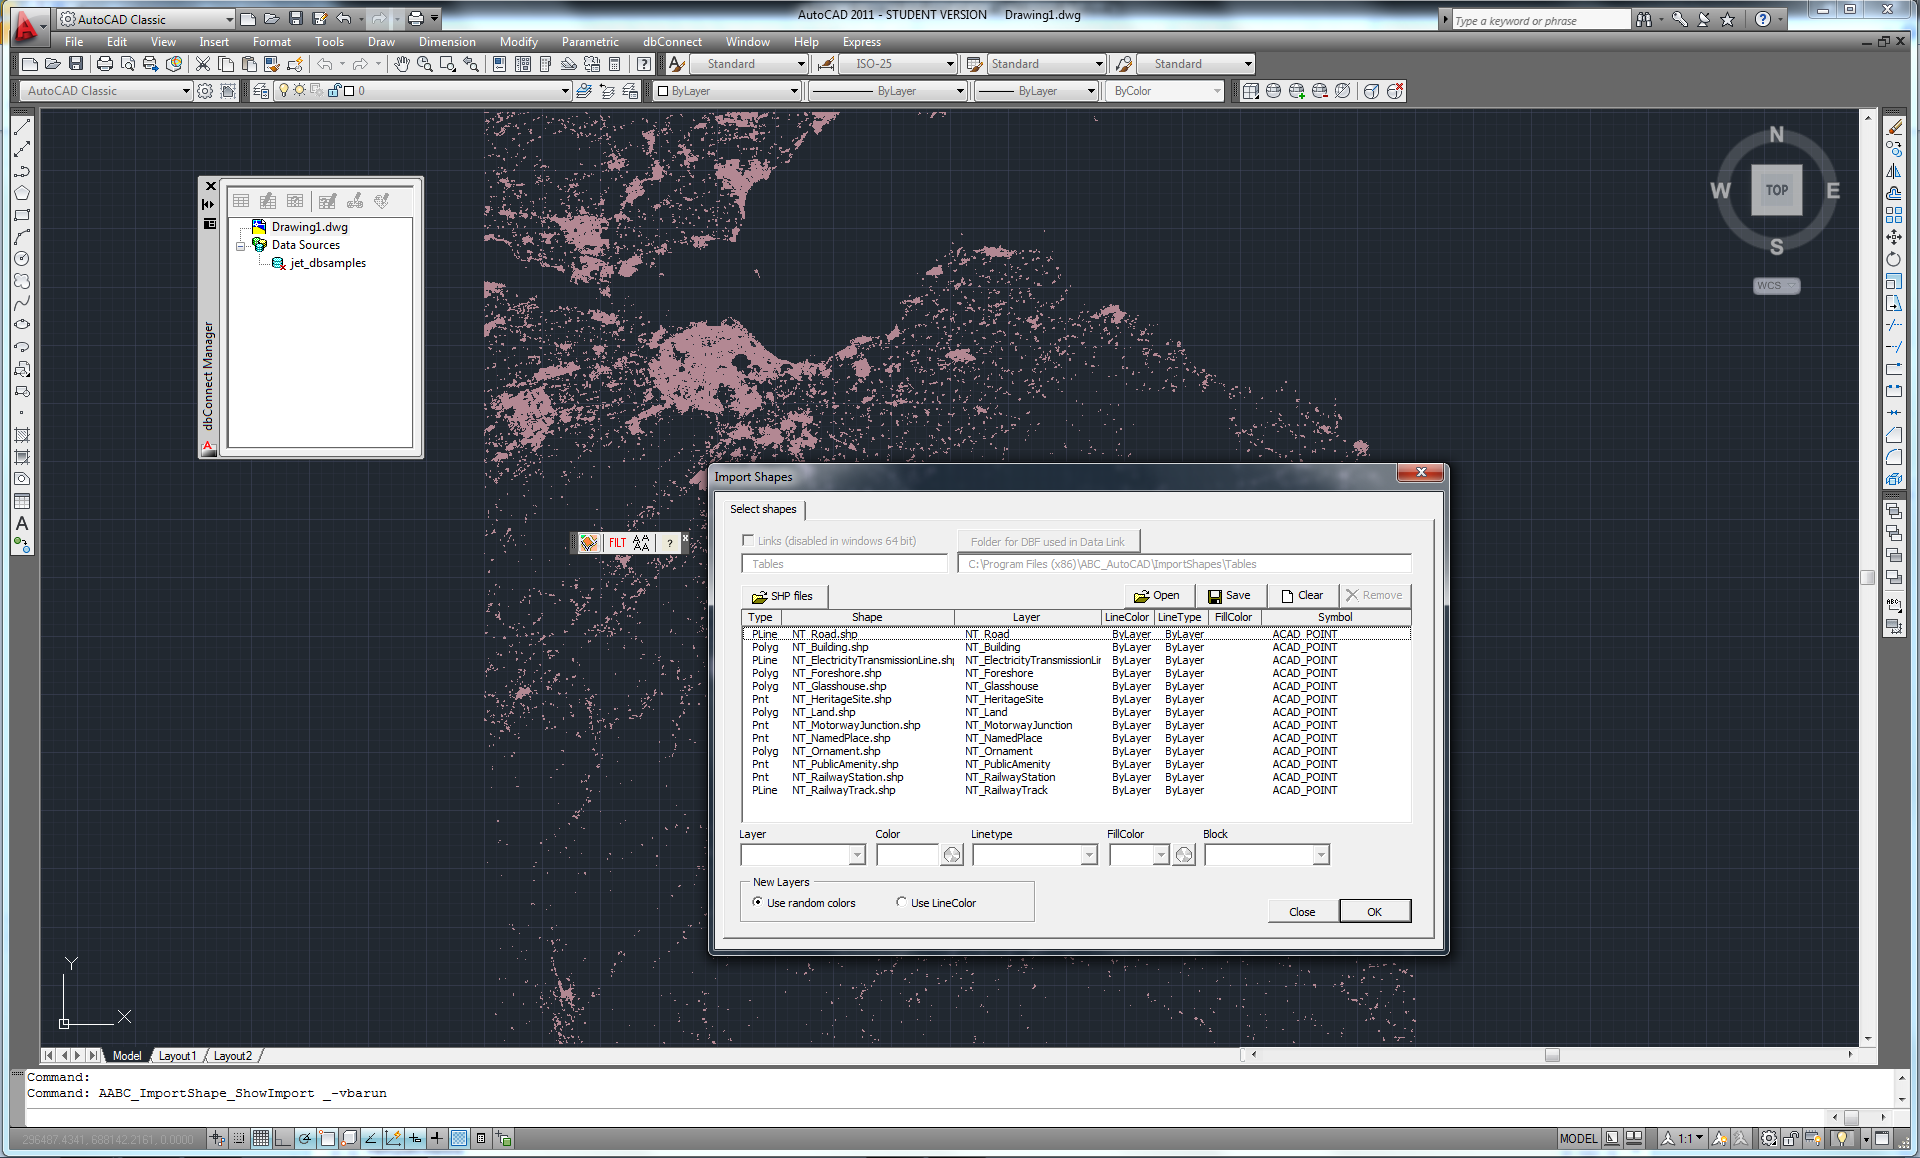
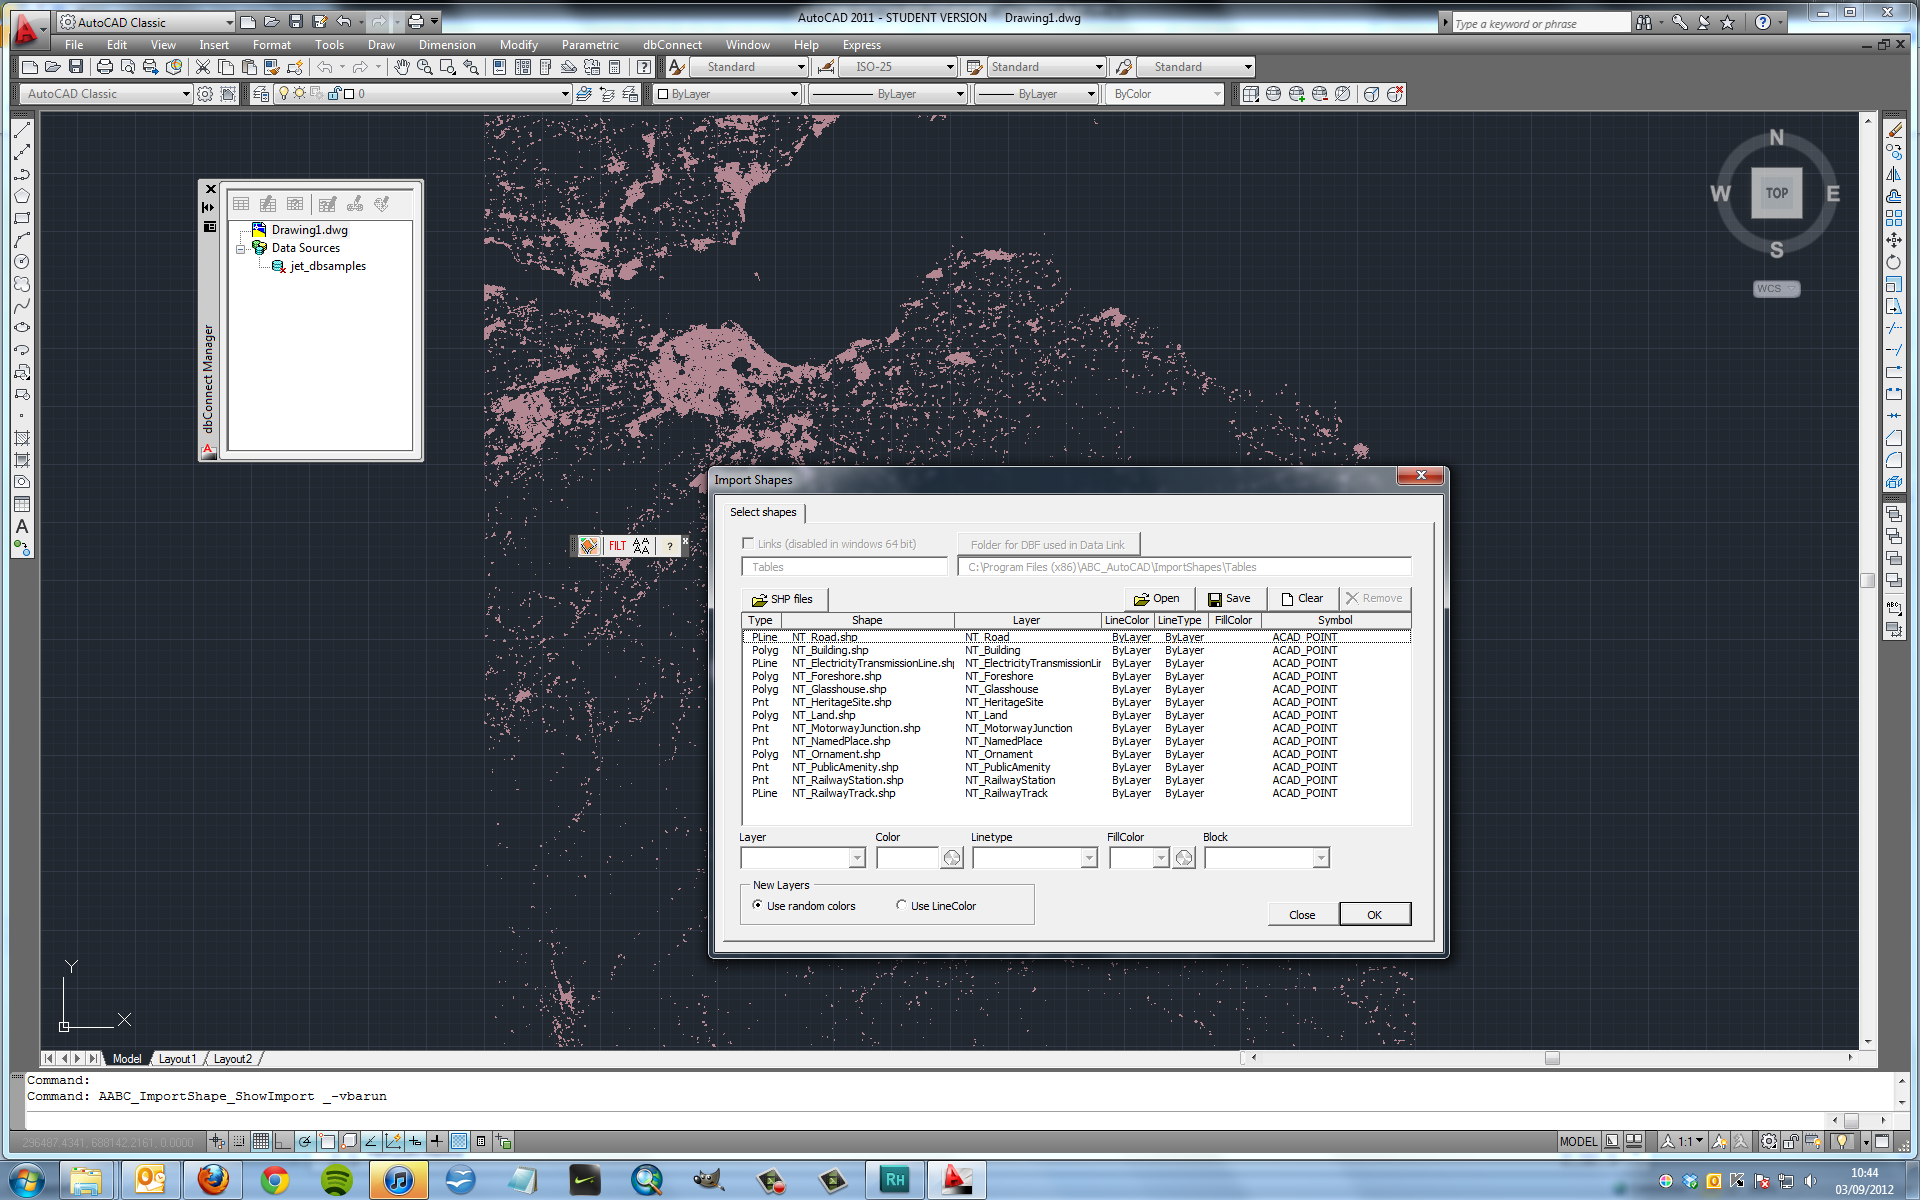
Open AutoCAD. Use the plugin to import the VML shapefiles. Convert to DWG/DXF as required.
It is unfortunate that these steps do not work with AutoCAD for Mac OS X and that AutoCAD Map 3D and AutoCAD Civil 3D are as yet unavailable for Mac OS X. If you are a Mac user, we suggest that you install a virtual PC on your Mac to run AutoCAD or contact us directly for help.
WARNING: EDINA makes no warranties, expressed or implied, regarding the software detailed here or its fitness for purpose. EDINA has not tested the processes detailed here on every combination of operating system and software version and makes no guarantees that every process will function on every platform. You should check the system requirements for any software you intend to use.
If you have any questions or comments, please feel free to get in touch here or via the EDINA Helpdesk.
Please note that the steps that follow are for PC users only. After testing we found that the steps do not work with AutoCAD for Mac OS X. Further, AutoCAD Map 3D and AutoCAD Civil 3D are as yet unavailable for Mac OS X. If you are a Mac user, we suggest that you install a virtual PC on your Mac to run AutoCAD or contact us directly for help.
We would advise you to upgrade to the latest version of AutoCAD if you are able.
Steps to import VMD to AutoCAD
AutoCAD 2012, 2013
Import the VMD shapefiles into AutoCAD Map 3D or AutoCAD Civil 3D. Then to convert to DWG/DXF for use in AutoCAD.
AutoCAD Map 3D
Import the VMD shapefiles. Convert to DWG/DXF as required.
AutoCAD Civil 3D
Import the VML shapefiles. Convert to DWG/DXF as required.
Open AutoCAD. Use the plugin to import the VML shapefiles. Convert to DWG/DXF as required.
It is unfortunate that these steps do not work for AutoCAD for Mac OS X and that AutoCAD Map 3D and AutoCAD Civil 3D are as yet unavailable for Mac OS X. If you are a Mac user, we suggest that you install a virtual PC on your Mac to run AutoCAD or contact us directly for help.
WARNING: EDINA makes no warranties, expressed or implied, regarding the software detailed here or its fitness for purpose. EDINA has not tested the processes detailed here on every combination of operating system and software version and makes no guarantees that every process will function on every platform. You should check the system requirements for any software you intend to use.
If you have any questions or comments, please feel free to get in touch here or via the EDINA Helpdesk.
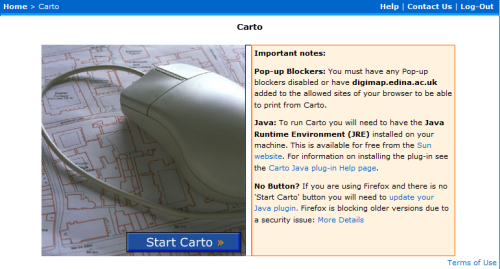
If you use Mozilla’s Firefox as your browser then you may not be able to access Digimap’s Carto application. The reason for this is that Mozilla is now (from the 30th August 2012) automatically blocking Java. The reason that Mozilla has taken this stance is that a Java exploit has been added to the notorious Blackhole exploit toolkit. In simple terms, running Java applications through your browser opens your machine up to hackers, and we dont want that.
We are working on Carto’s successor which we hope to launch in 2013 and this will not rely on Java. If you need to use Carto, then it will still work in Internet Explorer and Chrome browsers. Hopefully Java will patch the breach soon and it will work again in Firefox.
For more information about this security issue please read this.
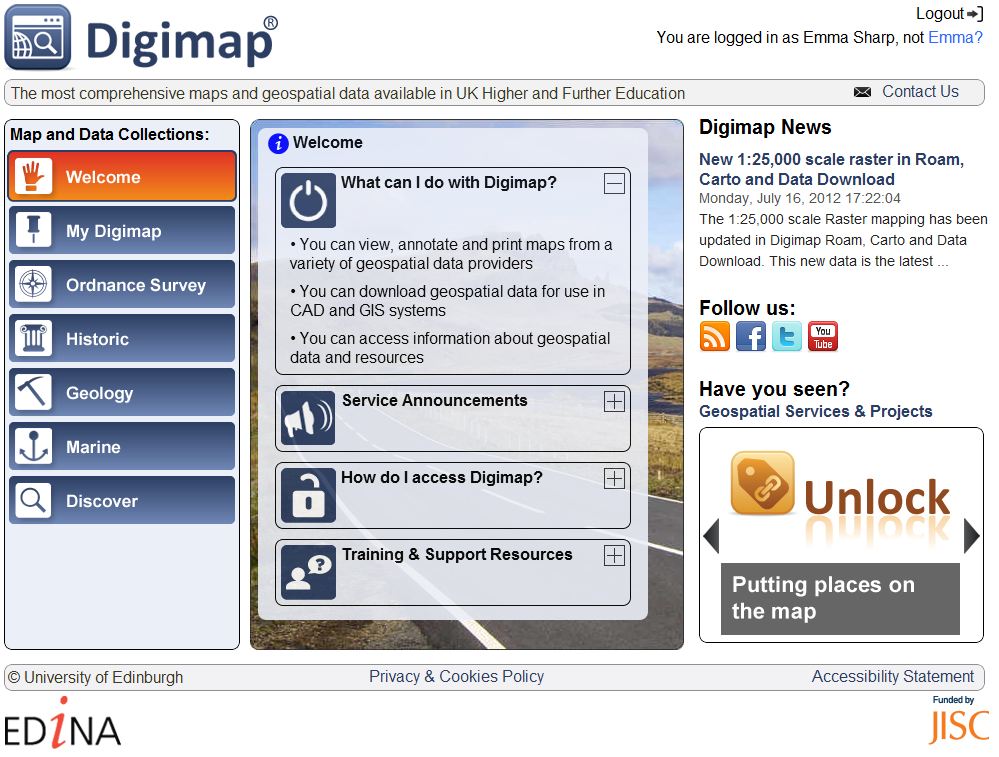
You may have noticed some changes to the Digimap interface over the past month. Yes, Digimap has a brand new and shiny new home page. The old home page had been around for a number of years and was starting to look it’s age. In this post we will take a look at the new interface to help you find your way around.
New Digimap Homepage
The new design splits the home page into 3 sections:
Maps and Data Collections panel – This panel provides top-level navigation allowing users to switch between different collections and account administration without having to leave the Digimap home page. When you select an option from this list, the information is displayed in the central panel.
Eagle-eyed users may have spotted that the left hand Maps and Data Collection panel has some room for expansion. We hope to add more data in the future and have been pulling together a number of environmental datasets which could form an Environment Collection. Do you have any suggestions for other collections you would like to see in Digimap? If you do, then add them as a comment.
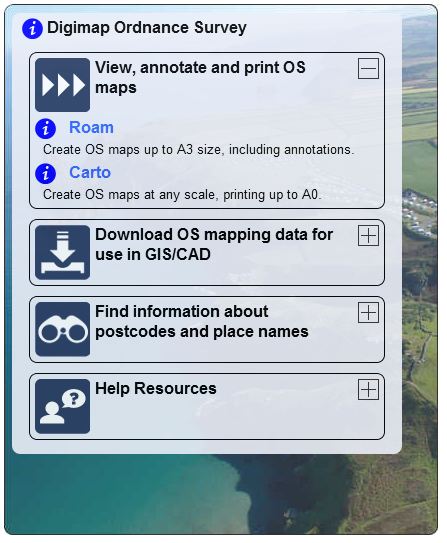
Central Panel – the central panel provides links and information related to the collection selected from the left panel. The information is split into sections which can be expanded or hidden by clicking on the section headings. If you want to make a simple map, click the “view annotate and print” section to see what is available. Services, such as Roam and Data Download are accessed by clicking on the service names. If you want help or further information about a collection, look under the “Help Resources” section.
Digimap Ordnance Survey Panel
News panel – On the right hand side of the home page you will find links to the Digimap blog and twitter account. We intend to post interesting Digimap news here as well so it is well worth having a quick glance at this panel as you pass through the home page.
One really good aspect of the new home page is that it allows users to see collections their institution do not currently subscribe to. Why is this good? Well, if a collection looks interesting and of use in teaching and learning you may be able to show colleagues who may then be able to convince institutions to subscribe. Think of it as a shop window!
However, it has not all been plain sailing. The cosmetic changes are just the tip of the iceberg. Significant work has taken place on the connections, authentication and the databases. This work was tricky and threw up some unforeseen issues. If you spot something that isn’t working or just looks wrong, please contact us (edina@ed.ac.uk). It helps if you can tell us which web browser you are using too (and which version!). We would also like to hear what you think of the new interface; just add a comment to this post or send comments to the help desk (edina@ed.ac.uk).
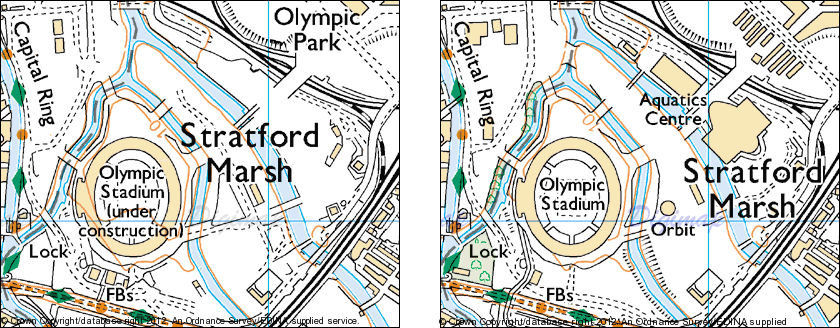
The 1:25,000 scale Raster mapping has been updated in Digimap Roam, Carto and Data Download. This new data is the latest release by Ordnance Survey from May 2012. There has been quite a few changes with just under a third of the country seeing updates with this release.
Some of the areas with the most changes have been in the Scottish Highlands and the main London 2012 Olympic site in East London.
It is great to see (what looks like) the mapping completed for the site, and to compare how it has taken shape over the last year. Download the maps from Data Download to view the changes for yourself.
Spot the difference between the Olympic site maps - 2011 (left) and 2012 (right)
On Tuesday 10th July we launched the new Digimap homepage. This makes it easier and quicker to find the services and resources you are looking for. The new interface allows you to browse the services available before logging in and you can even access all the training, help and support resources. There is a dynamic feed from the blog, a showcase of other services we offer, and links to our social media sites.
The new Digimap homepage is due to be launched on Tuesday 10th July. Unfortunately this will require a downtime in the morning, with potentially the whole day at risk.
This release will also include updates to Roam for saving, loading, import and export of annotations.
Thanks again to everyone who turned up to the event and helped make it so successful. If you weren’t able to attend or would like to remind yourself of what happened, the live blog recorded the main points of all of the presentations: Geoforum Live Blog
The new Data Download has been updated with a few more enhancements that will make it even easier to use; it is now no longer in BETA.
A selection of the improvements made include:
Changes to where you change between panning the map and drawing a rectangle to select to make it more obvious what you are doing.
A general improvement of the lay out and buttons used.
My Account has been moved to the top right of the screen.
Better product information by clicking on the icon.
You can clear the selection you have just made using the button.
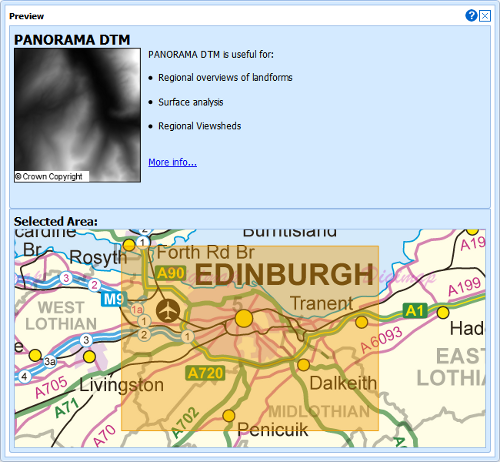
A greatly improved preview of the each dataset in basket, showing what the product is like, what it can be used for, and the extent of the area you are taking:
These changes have been made in response to recommendations from a usability project run in conjunction with the redevelopment of the Data Download service. You can read more about this project, called USeD, on its blog here:
The enhancements also include a fix to a bug that some users experienced when using the latest version of the Google Chrome web browser; the interface no longer offsets the area you select when displaying it on the map.

