Any views expressed within media held on this service are those of the contributors, should not be taken as approved or endorsed by the University, and do not necessarily reflect the views of the University in respect of any particular issue.
Digimap is an online map and data delivery service, available by subscription to UK Higher and Further Education establishments. Operated by EDINA at the University of Edinburgh, Digimap offers a number of data collections, including Ordnance Survey, historical, geological, aerial photography, LiDAR, marine maps, land cover mapping, global mapping and census data. For more information about Digimap go to our website: https://digimap.edina.ac.uk Background image Contains OS data (c) Crown Copyright and database right 2022
We have now added Ordnance Survey’s most detailed terrain data to the Data Download section of Digimap. OS Terrain 5 is created from the same source as the Ordnance Survey’s aerial imagery, meaning that it is kept up-to-date and works very well with the OS MasterMap® data.
OS Terrain 5 Contours, as the name suggests, have a 5 metre interval and the Digital Terrain Model (DTM) is on a 5 metre grid. The OS Website states the data has a good accuracy, typically exceeding 2 metres RMSE (not more than 2 metres different from the real world) with particular emphasis on significant landscape features such as roads, railways, slopes, quarries and lakes.
From Digimap’s Data Download the you can take up to 400 5 by 5 km tiles of OS Terrain 5 in a single download. The contour data is available in Shapefile or GML format and the DTM data is available as in ASC (Ascii Grid) format.
This new dataset has been included in Digimap due to the new licence agreement (see the previous blog post for more details). The other datasets included in the new licence, Urban Paths, MasterMap Site layer and Points of Interest data should be added into the service in the new year.
We are pleased to announce that a new Ordnance Survey licence agreement for Digimap is now available.
The new End User Licence Agreement (EULA) can be viewed in the Digimap Help Pages. As part of the new licence arrangements, end users need to agree to the EULA to access the Ordnance Survey data through the Digimap Service. Initially this will need to be done every time you access the collection via a popup after you select an application, however we are working on a new registration system that will mean you only need to do this once.
There is also an updated list of FAQs for the licence.
However, if you have any questions relating to the licence please do not hesitate to contact the Digimap support team.
Email: edina@ed.ac.uk
Phone: 0131 650 3302
What’s changed in the new agreement?
See below for key changes. Supplementary information is available from the EULA, the Ordnance Survey website and the EDINA helpdesk.
1. The following new products have been introduced to the Digimap Ordnance Survey collection under the new licence:
OS MasterMap® Integrated Transport Network Layer™ (ITN) Layer Urban Paths Theme.
OS MasterMap® Topography Layer will also contain the Sites Layer.
OS Terrain® 5, introduced as the new high resolution height dataset, replacing Land-Form PROFILE®.
PointX Points of Interest (PoI).
These will be made available through the Digimap service as soon as possible.
2. Changes to image publication size restrictions for external use
Image publication size restrictions have changed significantly with many being removed. Please refer to the Your Obligation/Restrictions section of the EULA, specifically Clause 5.1.4 and 5.2.
3. Public sector data sharing rights
In certain situations, it is now possible for you to share Digimap Ordnance Survey data with government departments and for government departments to share their Ordnance Survey data with you. For further details please see FAQs 27 & 28 in Licence FAQ section and consult the EULA Clause 4.
4. Authorised Data Handler
Where a Digimap Authorised User needs to use Ordnance Survey data in a secure data service, the new Digimap Licence now permits that via a separate Digimap Data Handler Agreement. Please see EULA Clause 3.1.4.
5. Educational navigation product/service
For Educational Use, you are now permitted to build Educational navigation apps. See the EULA, Clause 3.4 for the scope of what is permitted.
6. Use of YouTube and Twitter
You may now publish Ordnance Survey data, in line with strict terms detailed in EULA Clause 5, on YouTube and Twitter.
7. There is a change in the copyright notice that must be included on any maps
You must include the following acknowledgements on any display or reproduction of the Ordnance Survey Licensed data:
Where the date to be inserted should be the current year.
For HE institutions:
If you are responsible for your HE institution subscribing to Digimap Ordnance Survey Collection you should already have received an email from Jisc Collections detailing how your institution can agree to the new Sub-Licence. Full details can be found on the Jisc Collections website.
If you have any further questions then please contact the Digimap Support team:
Update 12/02/2015:The contents of this blog post have been moved to the Digimap Help system and can be found at the following location (link opens in a new window):
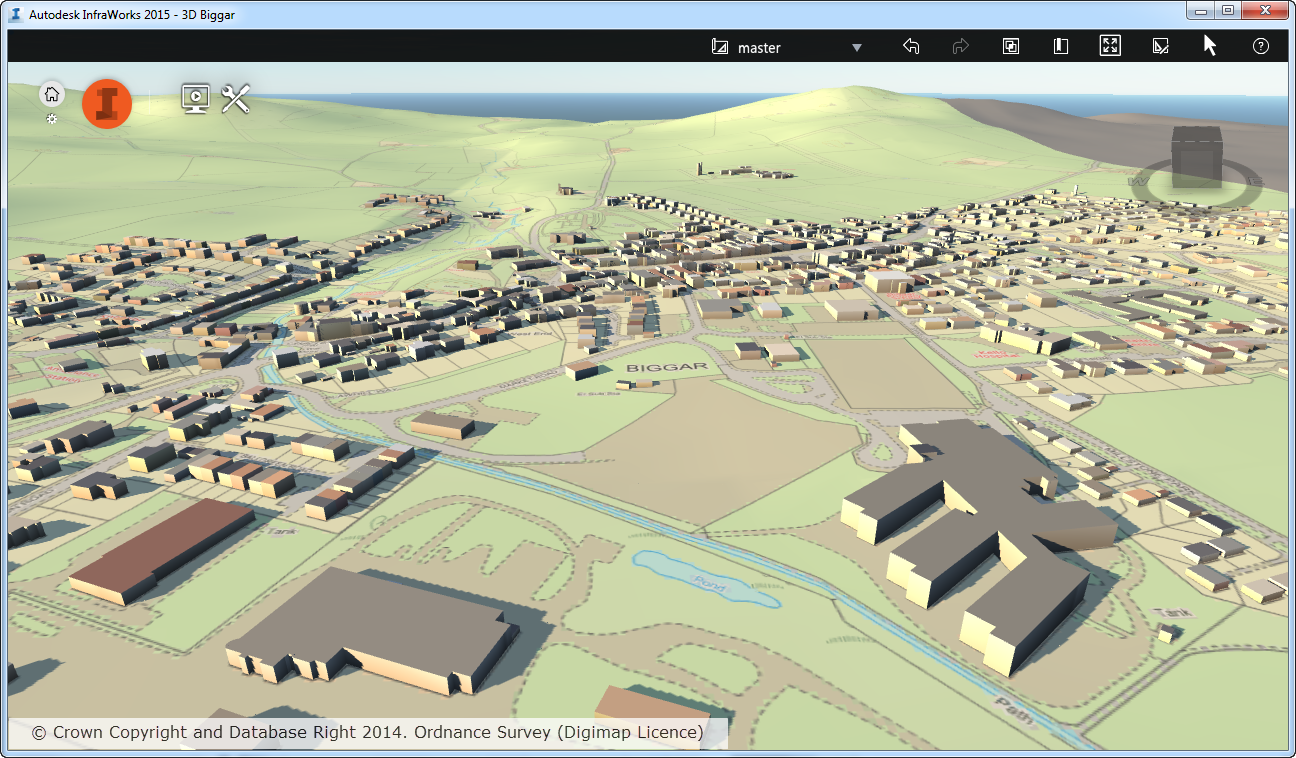
OS MasterMap® 1:2,000 Raster draped on top of OS Terrain™ 50, with buildings from OS MasterMap® Topography Layer extruded on top using Building Height Attribute data.
Update 12/02/2015:The contents of this blog post have been moved to the Digimap Help system and can be found at the following location (link opens in a new window):
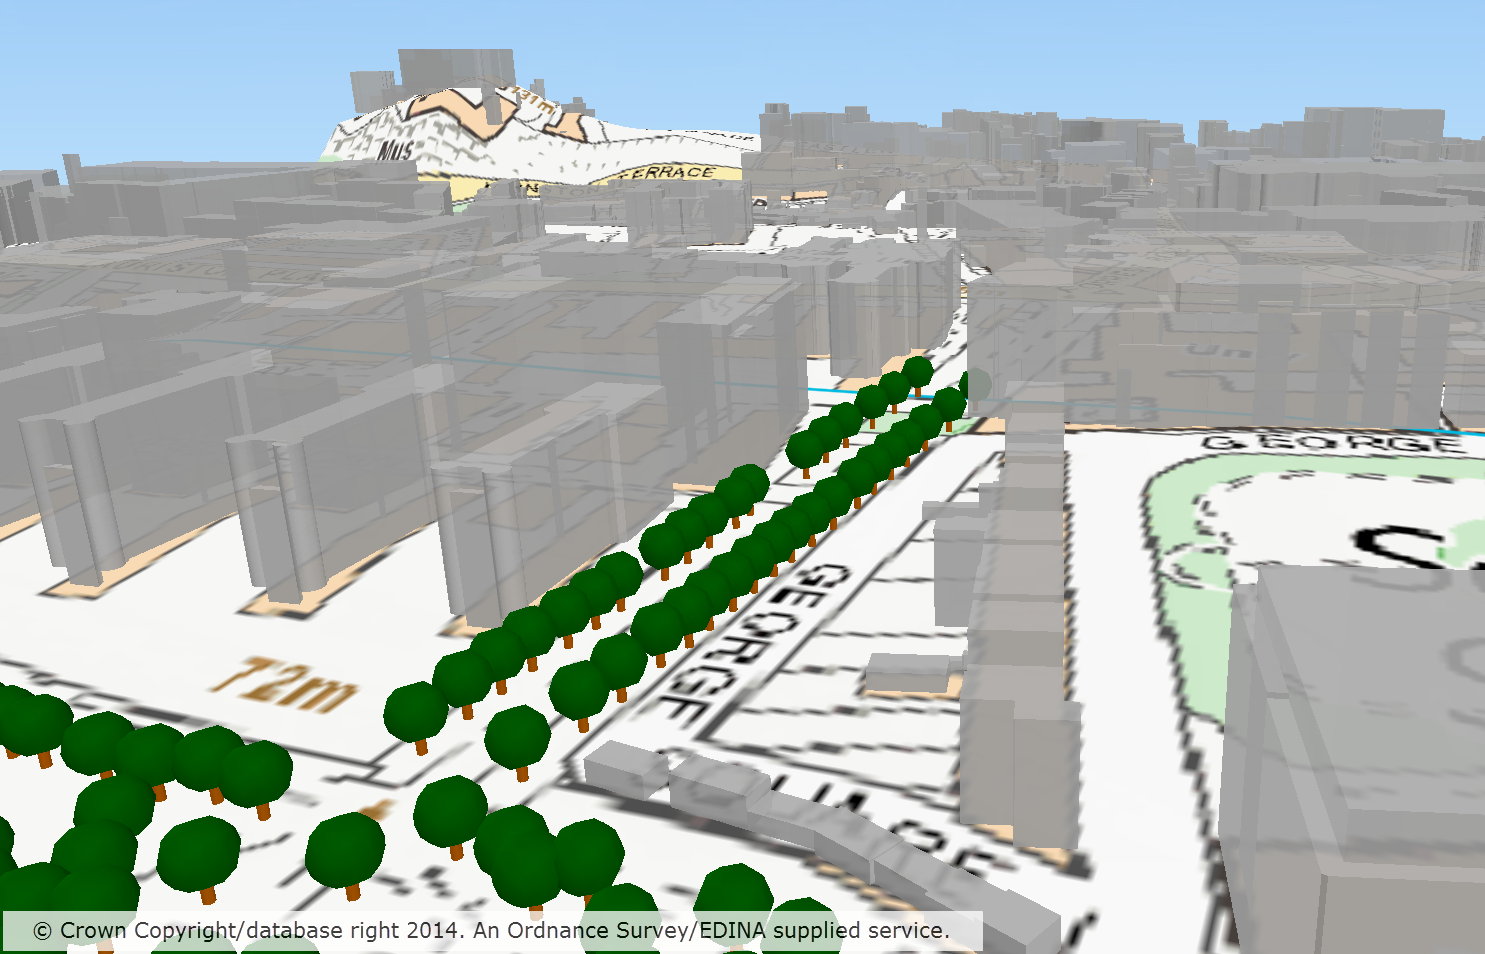
OS VectorMap® Local Raster draped on top of OS Terrain™ 50, with buildings from OS MasterMap® Topography Layer Building Height Attribute and Positioned Non Coniferous Trees extruded on top
To get the most from OS MasterMap data it is usually best to convert it from its supplied format, GML, to a format better suited to the software you are going to use it in. For our CAD users Digimap has been offering the DWG format for several months (see previous blog post); now we are offering a format that makes the data easier to use in GIS software.
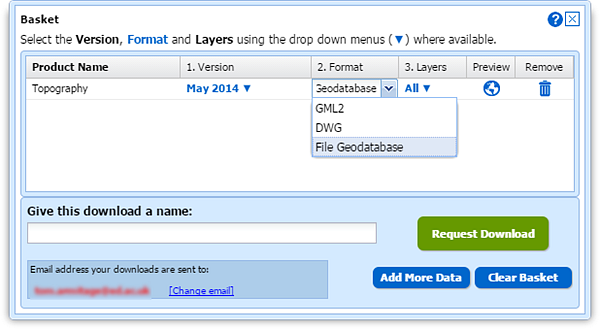
Although Shapefile is still the most commonly requested GIS format it cannot handle the large file sizes (over 2GB) that could be requested from the Data Download service; an area of 100km2 in an urban centre would exceed this limit. We therefore turned to the File Geodatabase format that works in the two most commonly used GIS software applications, ArcGIS and QGIS. There is more information about Geodatabases on Wikipedia here: Wikipedia -ArcGIS Geodatabase
To select the File Geodatabase format, add some MasterMap to your basket in Data Download. Once in the basket you can click the down arrow in the Format column and change it from the default GML to File Geodatabase:
Geodatabase formats are the recommended formats for use in ArcGIS software, being the most efficient for data storage and analysis. The format supports the use of .lyr files for styling the data and EDINA has provided some for the MasterMap data downloaded from Digimap.
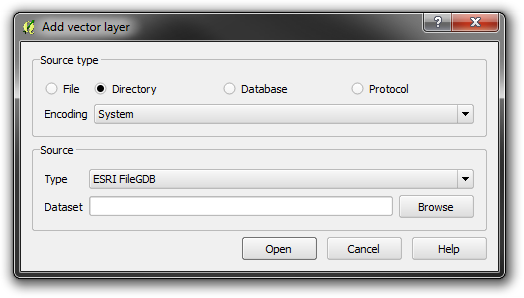
The data can be added to a map in ArcGIS and QGIS in the usual way, though in QGIS you need to use Add vector layer –> Directory rather than a Database as you may assume.
Styling information for both ArcGIS and QGIS has been provided by EDINA in .lyr and QML formats, these can be found at the bottom of Digimap’s help page for OS MasterMap. These representations give enough information to view the data in a style that OS MasterMap is commonly viewed in. The help page also contains a link to the official Ordnance Survey SLD styling information, please see the PDF that comes with the SLD files for information on how to use them.
Update 12/02/2015:The contents of this blog post have been moved to the Digimap Help system and can be found at the following location (link opens in a new window):
Even though we update our mapping data throughout the year we still make a large number of changes over the summer.
Along with the general updates to MasterMap and a few other products the biggest change over the summer has been to swap the 1:10 000 Scale Raster maps to VectorMap Local Raster maps in Digimap Roam. Ordnance Survey have retired the 1:10 000 data, so we have removed it from the online maps, though you do still have a couple of options if you are a fan of the product:
You can view the VectorMap Local data styled to look like the 1:10 000 maps at two zoom levels in Roam; remember that on the Map Content tab you can remove the contours for a very close representation of the mapping.
We still make the 1:10 000 data available in Digimap’s Data Download interface, and will continue to do so for at least this academic year.
The table below details all of the latest changes we have made showing the currency dates of all Ordnance Survey datasets in Digimap.
Digimap Roam
Ordnance Survey product
Data Currency
Last updated in Roam
OS MasterMap® Topography Layer
May 2014
July 2014
OS VectorMap® Local
July 2014
September 2014
OS VectorMap® Local Raster
July 2014
September 2014
1:25 000 Scale Colour Raster
March 2014
March 2014
1:50 000 Scale Colour Raster
June 2014
July 2014
Meridian™ 2
January 2014
March 2014
OS Terrain™ 50
July 2013
October 2013
OS VectorMap® District Raster
September 2014
September 2014
Strategi®
January 2014
March 2014
1:250 000 Scale Colour Raster
June 2014
September 2014
MiniScale®
January 2014
February 2014
Data Download
Ordnance Survey product
Data Currency
Last updated in Data Download
OS MasterMap® Integrated
Transport Network™ (ITN) Layer
May 2014
September 2014
OS MasterMap® Topography Layer
May 2013
September 2014
OS MasterMap® Topography Layer Raster
June 2013
October 2013
Backdrop Mapping
* 1:10 000 Scale Raster
June 2013
October 2013
OS Street View®
April 2014
April 2014
1:25 000 Scale Colour Raster
March 2014
March 2014
OS VectorMap® Local Raster
July 2014
September 2014
OS VectorMap® District Raster
September 2014
September 2014
1:50 000 Scale Colour Raster
June 2014
July 2014
1:250 000 Scale Colour Raster
June 2014
June 2014
MiniScale®
January 2014
January 2014
Land and Height Data
* Land-Form PROFILE®
November 2009
September 2011
* Land-Form PROFILE® DTM
November 2009
September 2011
OS Terrain™ 50
July 2014
September 2014
OS Terrain™ 50 DTM
July 2014
September 2014
* Land-Form PANORAMA®
November 1993
September 2011
* Land-Form PANORAMA ® DTM
June 2006
September 2011
Vector Data
OS VectorMap® Local
July 2014
September 2014
OS VectorMap® District
September 2014
September 2014
Meridian™ 2
January 2014
February 2014
Strategi®
January 2014
February 2014
Boundary and Location Data
Boundary-Line™
May 2014
May 2014
Code-Point®
August 2014
September 2014
Code-Point® Open
August 2014
September 2014
Code-Point® with polygons
April 2014
July 2014
OS Locator™
May 2014
May 2014
1:50 000 Scale Gazetteer
June 2014
June 2014
* Land-Form PANORAMA®, PROFILE® and 1:10 000 Scale Raster products have been withdrawn by Ordnance Survey and are no longer updated.
Other Updates
Remember there have also been substantial changes made to the Geology and Marine data holdings in recent months:
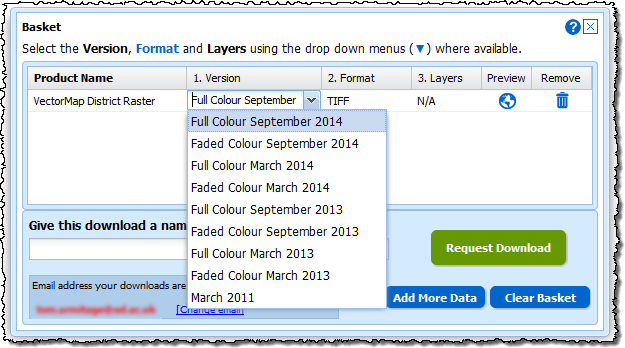
It is now easier to see which formats are available for the data product you are downloading and change it if you need to, this blog post shows you how:
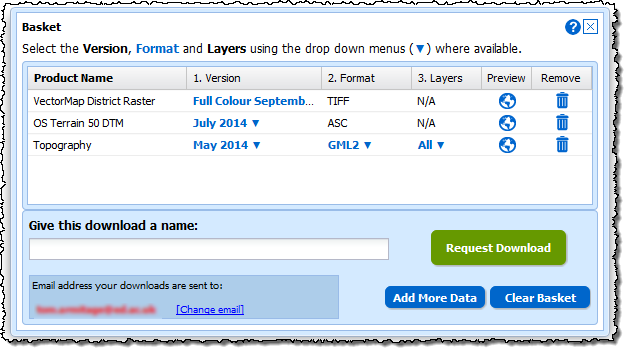
We have updated all the new style Download interfaces in Digimap to make it easier to change the options for the data you have selected. When you have added some data to your basket you can now see more clearly what can be changed; the version (date and style), the format and the layers.
Where these options are highlighted in blue with a ▼ next to them you can click them and get a drop down menu with the alternatives.
Make the changes you need, add a name, then click on the Request Download button to order your data.
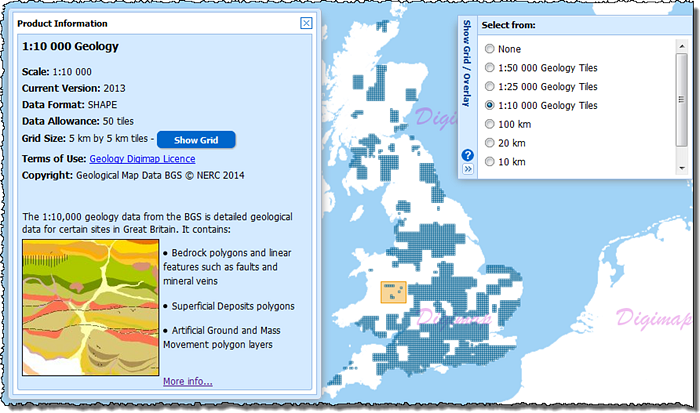
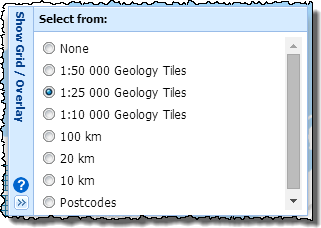
We have also made a slight change to the Product Information pages for some of the data products too. Where the data is available on tiles you can now click a Show Grid button to see the tile outlines on the map. When you make a selection on the map you will get all the grid tiles that are partially or entirely within your orange selection area.
This feature is particularly useful for data products like the 1:10,000 and 1:25,000 scale geology data and the Marine HydroView Charts, where the data isn’t a continuous coverage and your selected area may contain no tiles. When you click the Show Grid button it will also automatically open the menu from the right of the map which allows you to change the grid shown or switch it off.
Remember, you open the Product Information panels by clicking on the blue Info links in the list of data products to the left of the map.
Please let us know if you have any questions about these changes or anything else:
We have now added detailed 1:10,000 and 1:25,000 geological mapping data and 1:625,000 hydrogeological data to Geology Download. The mapping data is the most detailed geological mapping available from the British Geological Survey (BGS), consisting of four polygon layers:
bedrock geology (‘solid’);
superficial deposits (‘drift’ or Quaternary)
mass movement (mostly landslide)
artificial (or man-made ground)
…and one linear features layer, including:
thin beds (such as coal seams and fossil bands)
faults
mineral veins
some landforms
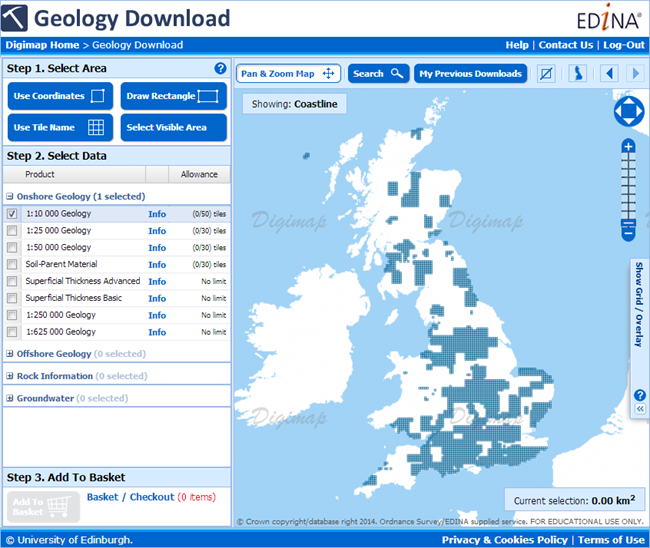
The products cover around 30% of the UK most of the which is provided by the 1:10,000 scale data (approx 28% of the UK), as the coverage is not complete we have added overlays to Geology Download to guide you to the areas where it can be found. The BGS have more map tiles in production for this dataset and we will add them to the service as they become available to us. The coverage of the data can be seen in the Download interface below as the dark blue areas of Great Britain.
The 1:25,000 has a much smaller coverage, but with little overlap with the 1:10,000 it makes a good companion dataset to fill in the gaps. The 1:25,000 data also fills the gaps in the 1:50,000 data in Wales, again the coverage can be seen in the interface below as the dark blue areas.
To access the coverage maps click on the double arrow to open the Show Grid / Overlay panel on the right side of the map; you can then add the grids to the map to see where data is available. We highly recommend you do this before selecting your area for download as it is not possible to add data to your basket if you choose a product with no coverage for your that area. If you find that the Add to Basket button remains grey after you have selected your products it probably means that one or more of them do not have coverage for the area you have chosen. If you click on the grey button an error message will tell you which products are unavailable, either remove these from the order or switch on the overlay and choose a different location that has the data.
In addition to the 1:10,000 and 1:25,000 scale mapping datasets we have also added the BGS OpenData 1:625,000 scale digital hydrogeological data to Geology Download. This data can be used to indicate the aquifer potential of an area in generalised terms. Areas are categorised into one of three groups:
those in which intergranular flow in the saturated zone is dominant
those in which flow is controlled by fissures or discontinuities
less permeable formations including aquifers concealed at depth beneath covering layers
The 1:625 000 scale data may be used as a guide to the aquifers at a regional or national level, but should not be relied on for local information.
The addition of these new datasets brings the total number of different BGS products in Geology Download to 14. We hope to add the detailed mapping datasets to Geology Roam later in the year as well as some of the other types of data as overlays or basemaps.
If you have any questions about the new datasets or any requests for geology data we don’t yet have then please get in touch:
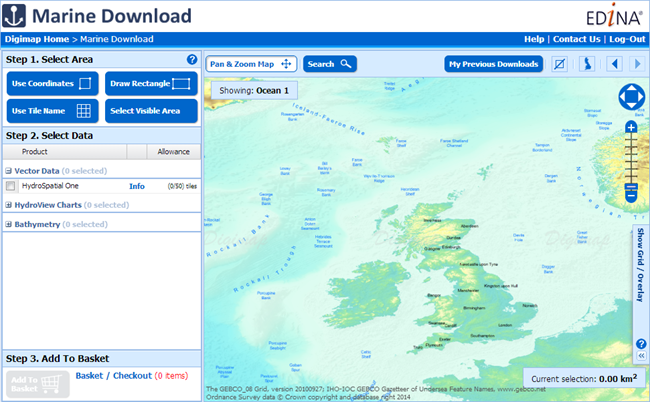
Marine Digimap has updated datasets in its brand new Marine Download facility. The new interface provides a single place to get both Hydrospatial data and charts. The Hydrospatial data is now the newer Hydrospatial One dataset from SeaZone which also provides access to much higher resolution gridded bathymetry data, one arc second instead of six. The Charted Raster dataset has been replaced with Hydroview Charts; these are still the same scanned Admiralty Charts though they are much more recent and include some small scale charts covering whole oceans (still not for navigation though!).
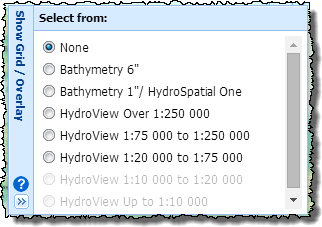
Marine Download works in the same way as Data Download, Environment Download and Geology Download; you select your area, pick your products and download the data. The main difference is with datasets as these don’t all form continuous coverage of the UK Coastal waters. We have therefore included overlays that show where the tiles of each dataset can be found. These are very useful when choosing your data, just open the “Show Grid / Overlay” menu on the right of the map and pick the overlay for the data you are selecting.
Remember there can be a lot of overlap between the Hydroview Charts and also large areas with no data, you will get all the charts that present for the area and scale band that you choose. If there is no data for the area you have selected then you will not be able to add anything to the basket, if you try you will get an error message informing you of the products with no coverage.
For a full description on how to use the new interface, have a look at the help page: How to use Marine Download
The data in Marine Download is broken into three categories, Hydrospatial, Hydroview Charts and Bathymetry. In the Hydrospatial category the same themes as before can be found, the Hydroview Charts are broken up into categories depending on their scale including those extra charts with wider ocean or global extents.
The old interfaces for downloading data, Hydrospatial Download and Charted Raster Download, will be withdrawn in the coming weeks, if you have teaching materials that include them then please update these as soon as possible.
If you have any questions about the new download or the withdrawal of the old interfaces then please get in touch:


 Marine Download works in the same way as Data Download, Environment Download and Geology Download; you select your area, pick your products and download the data. The main difference is with datasets as these don’t all form continuous coverage of the UK Coastal waters. We have therefore included overlays that show where the tiles of each dataset can be found. These are very useful when choosing your data, just open the “Show Grid / Overlay” menu on the right of the map and pick the overlay for the data you are selecting.
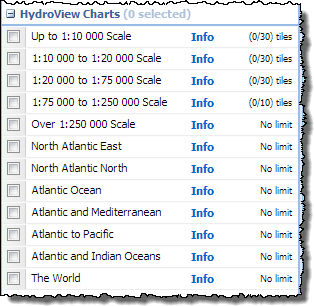 The data in Marine Download is broken into three categories, Hydrospatial, Hydroview Charts and Bathymetry. In the Hydrospatial category the same themes as before can be found, the Hydroview Charts are broken up into categories depending on their scale including those extra charts with wider ocean or global extents.