Piccolo3 System User Guide. Section 03. Browser control interface
Guidance for using the Piccolo Browser GUI to control a Piccolo system to make spectroscopic measurements with considerations for field use.
Section 03a
The following steps are to connect to a Piccolo over an Ethernet connection. Note if connecting directly through either a monitor or a Raspberry Pi touch screen see further guidance Section 03b and 03c below
- Select your link-local connection as connection option
- Open a terminal and ssh to the piccolo. Either > ssh pi@picciolo3-* .local (use your own piccolo id and .local) or > ssh pi@*(your pi ip address ).local
- Insert password as requested and terminal prompt will change to show that you are on the Raspberry Pi
- Start Chrome or Firefox on your computer and insert either your Raspberry Pi3 ip address or piccolo3 id in the URL line and it will connect to the Piccolo3 browser dashboard. It may be useful to bookmark this connection

Figure 1. Piccolo3 browser Dashboard
- Piccolo3 browser control dashboard will be displayed in your browser as in Fig. 1.
- Note the Piccolo3 runs on: GPS time if a GPS is attached; internet time if on a network; or from a laptop and dta (*.pico) files are date and time stamped accordingly. Currently the Browser code converts Piccolo time to Local time but only in the browser display. TeamPiccolo have not found a way round that Java function yet. Pay careful attention to the time zones stated. The Scheduler is programmed in the time zone of the Piccolo clock. Piccolo Time should always be UTC as this is the time provided with GPS to match to remote sensed data from satellite and airborne platforms. It is the time used as the time stamp in each sequence measured by the Piccolo system. N.B. When you connect the Piccolo to a computer and start the browser it will take the time from that computer. It is the users responsibility to ensure that the computer time is correct, in the right time zone and that Piccolo Player displays this correctly.Note the path to the data directory on the memory stick attached to the Piccolo Raspberry Pi control computer is displayed in this window. The latest (20180529 and after) version of player displays CPU use (RPi B+ displayed. If a RPi 2B is used the% use will be in the order off 10% ) and memory use. If the memory begins to fill up during operation the system should be rebooted. One days operation can be expected before rebooting is necessary.
- The “Idle ‘ with the green leaf indicates the Piccolo system status.
- The Record tab (Fig. 2) is used to set the record functions of Piccolo3. The serial numbers of all attached spectrometers are displayed and maximum and minimum integration time can be set but only within the max/mins specified by the spectrometer manufacturers. The integration times for each measurement (for each spectrometer and each view direction) can be set manually. Note after populating each dialogue the return key must be pressed to send the value to the Piccolo3 server. If not it will revert to the one stored on the server from previous measurements. The “Run” directory name is also set in this browser window.
- Piccolo3 file naming convention. A “Run” will contain batches of sequences. The name selected for each Run should be meaningful to enable the data structure to be understood at a later date. A batch is a number of *.pico files (indicated by the b in the batch and sequence file name b*_s*.pico ) with each containing sequences of measurements. A sequence (indicated by the s in the batch and sequence file name b*_s*.pico ) will contain a number of up/down measurement pairs, the number of pairs dependent on number of spectrometers attached. Integrations times for each spectrometer/direction specific measurement will not change in a batch. Each time an integration time changes or a new batch is recorded. For example, the b* (i.e. b000000_s000000.pico) wil increment up by 1 (i.e. to b000001_s000000.pico). The number of sequences required should be set by the user and each measurement in the batch of sequences used to derive the mean. The sequence will start at 0 (i.e. b000000_s000000.pico) and increment up by 1 each time a sequence is measured up to the number of sequences specified in the dialogue (i.e b000000_s000014.pico to have saved 15 sequences in the first batch)

Figure 2 Piccolo3 browser Record tab
- An autointegration function is available. In the dialogue ” -1″ is for no auto integration; “0” is for auto integration on first sequence in each batch; “1” is for auto integration on every sequence in a batch; “2” is for auto integration on the second each sequence in each batch. “3” the third and so on. If the integration time changes the batch number will increment up by 1. CAVEAT the autointegration function needs to be used intelligently and with great consideration given to skylight dynamics. It cannot account for rapidly changing skylight intensity when cloud cover is present. See section of skylight dynamics for spectroscopy. The auto integration target percentage can also be set.
- If the Auto button is used this will populate the integration time fields but no measurement will be taken. This function can be used to get a reasonable estimate of integration time needed (ensuring that neither fore optic is shaded) for the current skylight condition and help inform decisions.
- The browser Scheduler tab (Fig.3), or the Linux “cron” function, can be used to define diurnal and multi-date measurement logging schedules. The start and end time and date and interval between batches (“schedule interval” in secs) can be set in the Scheduler tab. “quiet times” times can be set (i.e. set when measurements are not made) to avoid collection of data during the hours of darkness or very low light levels and to minimise ware of shutters.
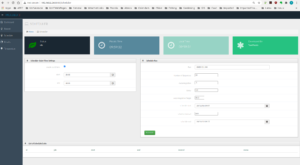
Figure 3. Piccolo3 browser Scheduler tab
- Data can be viewed in the browser Record tab (Fig.4). All measurement in the last sequence recorded in the current Run are displayed automatically. Sequences from either direction can be displayed by selecting as appropriate from the Direction dropdown tab towards the bottom of the window, specific sequences can be displayed by selecting from the Spectra List, and Runs from the Run dropdown list. Note there is no zoom function this tab is only for viewing raw data to check that reasonable measurements have been made – it is not for analysis.
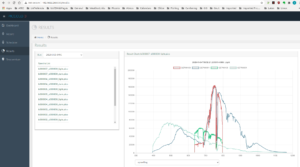
Figure 4. Piccolo3 browser Results tab
- The spectrometer thermo-electric cooler set and current temperature, when appropriate spectrometers are attached, can be viewed through the browser Temperature tab. These set temperatures should not be changed using this tab except for specific detector temperature response research application. Note the set temperatures are defined on the piccolo.config on the memory stick and are set at time of system radiometric calibration. Any changes to these temperatures will void the calibration.
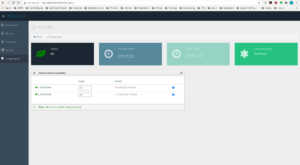
Figure 5 Piccolo3 browser Temperature tab
Section 03b. To connect Piccolo3-*dsk (configured for Coolbox operation) using a directly (HDMI) connected monitor
- Connect a monitor to the Piccolo3’s Raspberry Pi using an HDMI cable
- Attach and keyboard and a mouse to the Raspbery Pi by Usb
- Power up monitor
- Power up Picclo3/RPi
- The RPi desktop should display on the monitor
- Open the RPi chromium browser
- Type the P3 system ‘hostname’ (piccolo3-*dsk:8000) into the browser url line and the Piccolo3 control interface should be displayed.
Section 03c
Controlling the Piccolo3 through a browser in a Raspberry Pi touch screen
Comments are closed
Comments to this thread have been closed by the post author or by an administrator.