This year, the annual retreat for some of our staff and Ph.D students has been scheduled at a time when I can go to it. Which is nice, but it does mean that I have to work up a talk on whatever research I am managing to get done. And I was just scratching my head about what I might talk about, when I heard that there had been a major volcanic eruption of a volcano called Calbuco in Chile. So I can talk about something newsworthy by giving an update on my work on volcanic SO2 in the stratosphere as measured by MLS (see previous blog posts here and here) to show the measurements from this new eruption.
The eruption was big enough to cause considerable grief to the local inhabitants, many of whom had to remove many centimetres of volcanic ash from the roofs of their houses. That doesn’t necessarily mean it affected the stratosphere. The internet is full of dramatic pictures of the event, such as this one:
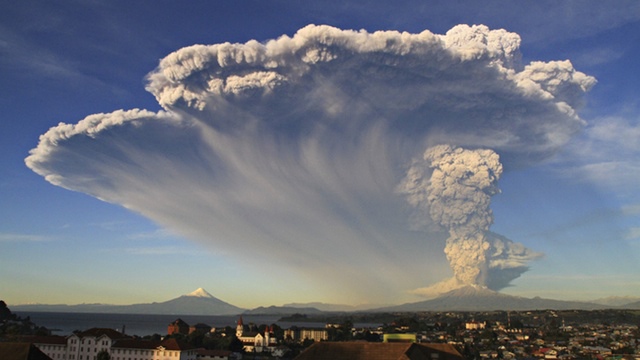 (I’m having trouble finding the provenance of this photo; I think it may be (c) the Guardian, but Google doesn’t make this clear.) The photo shows the ash plume going to a pretty impressive height, suggesting that the stratosphere might be affected, so it was definitely worth looking at the data in some detail. I processed the data as I did for the paper, counting up the places where the MLS instrument observes unusual amounts of SO2.
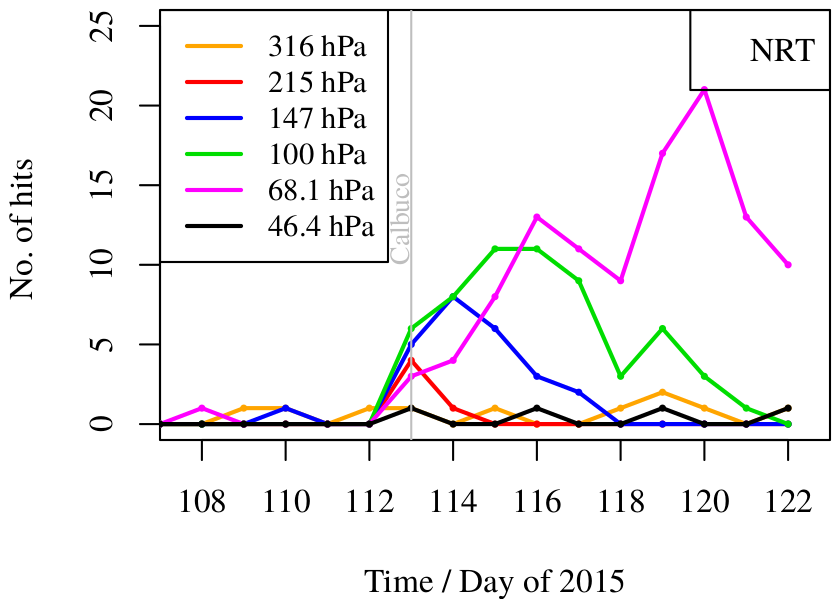
The eruption is clearly visible in the data starting on day 113 of the year (23 April) and is still visible on the latest day that I have (day 122 or 2 May). The data in the picture are a special data stream called the near-real-time (NRT) stream; they are not processed as carefully, but become available a day or two earlier. A map of the measurements with enhanced SO2 looks like this:
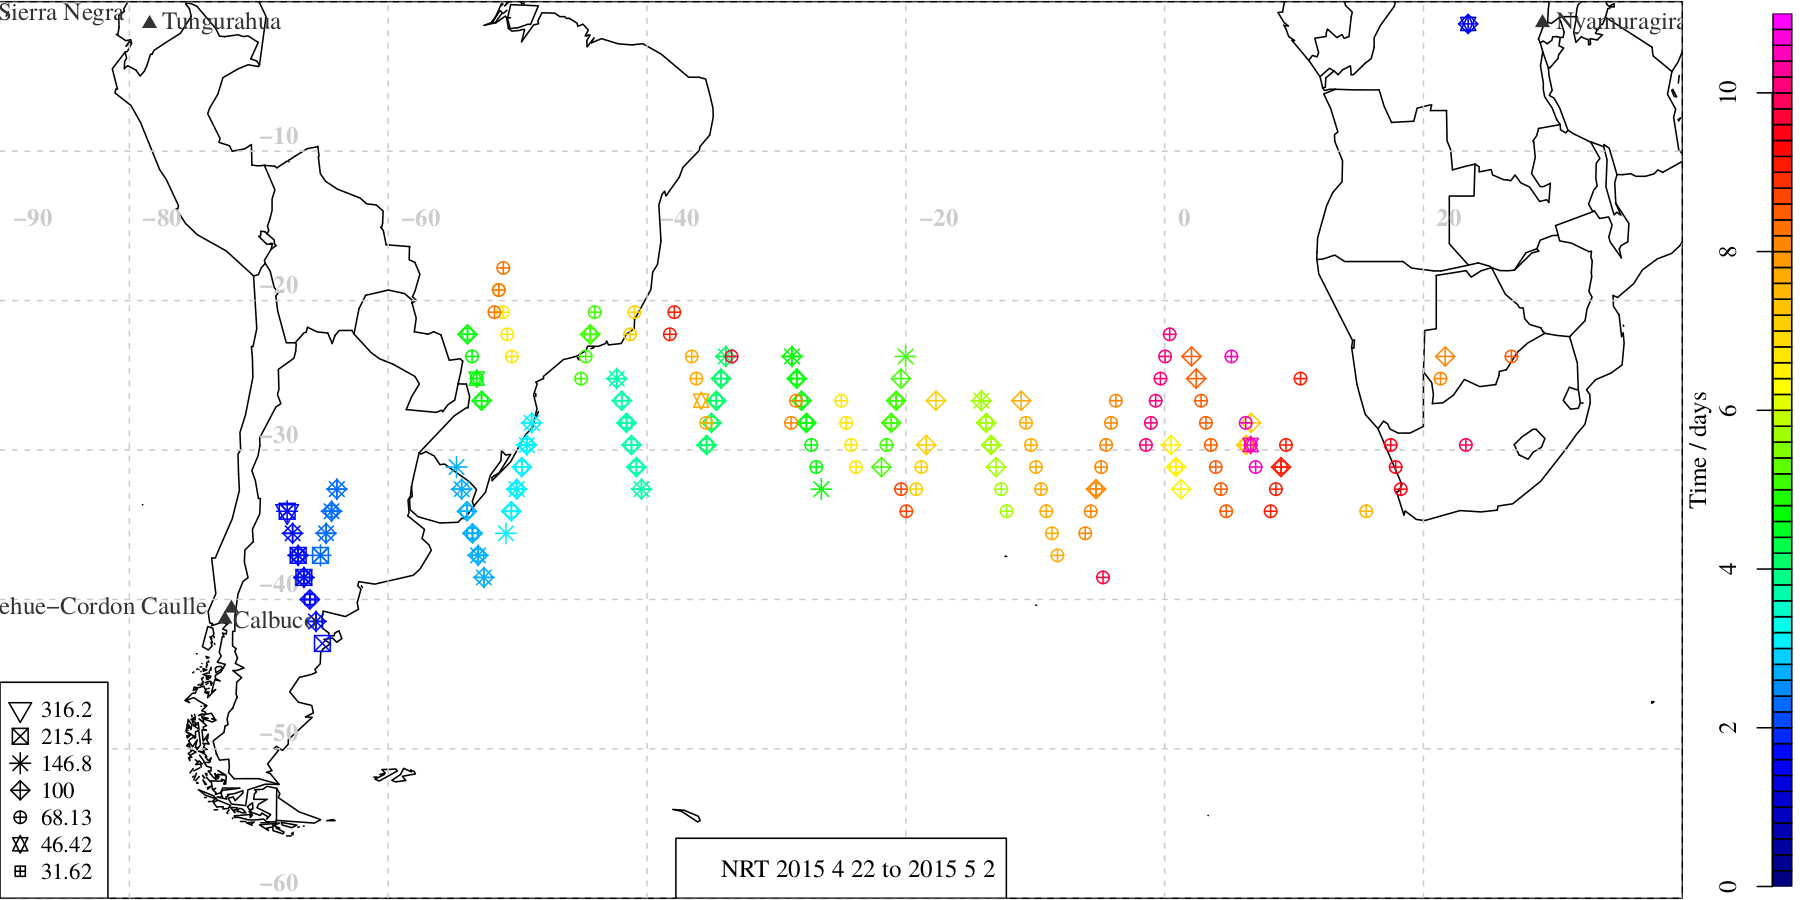
The colours represent time after the eruption day; it is clear that the plume has travelled some distance to the North and spread itself out across the Atlantic, reaching as far as Southern Africa.
The SO2 injection into the statosphere looks as if it is bigger than that from Kelut in February last year. To find out, I re-did the calculation of the total mass of SO2 in the stratosphere. This is done as per figure 12 in my SO2 paper, I have taken most of the other volcanoes out but have left two in for comparison.
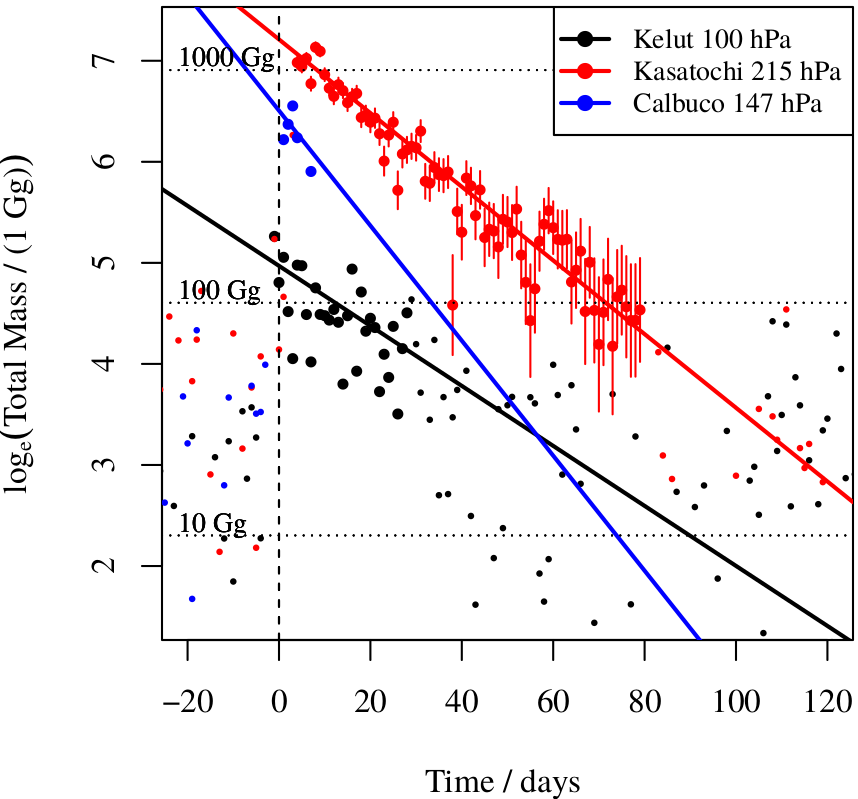
My initial estimate is that Calbuco injected 670±150 Gg of SO2; I imagine that this estimate will be refined as I get in more data. Nevertheless, it is already good enough to place Calbuco third or fourth of the eruptions in the MLS era, in terms of injected SO2, behind Kasatochi (2008) and Sarychev (2009), similar to Nabro (2011) and well ahead of all the others. Of course, nothing in this period is on the scale of Pinatubo in 1991; that was 17000 Gg, so Calbuco was about 4% of a Pinatubo.
You can keep track of when and where MLS observes unusual amounts of SO2 here (time series) and here (map). These plots are generated automatically every day. They are essentially the same as the plots in this blog post, although they use a less strict criterion for “unusual”.

