Any views expressed within media held on this service are those of the contributors, should not be taken as approved or endorsed by the University, and do not necessarily reflect the views of the University in respect of any particular issue.
Digimap is an online map and data delivery service, available by subscription to UK Higher and Further Education establishments. Operated by EDINA at the University of Edinburgh, Digimap offers a number of data collections, including Ordnance Survey, historical, geological, aerial photography, LiDAR, marine maps, land cover mapping, global mapping and census data. For more information about Digimap go to our website: https://digimap.edina.ac.uk Background image Contains OS data (c) Crown Copyright and database right 2022
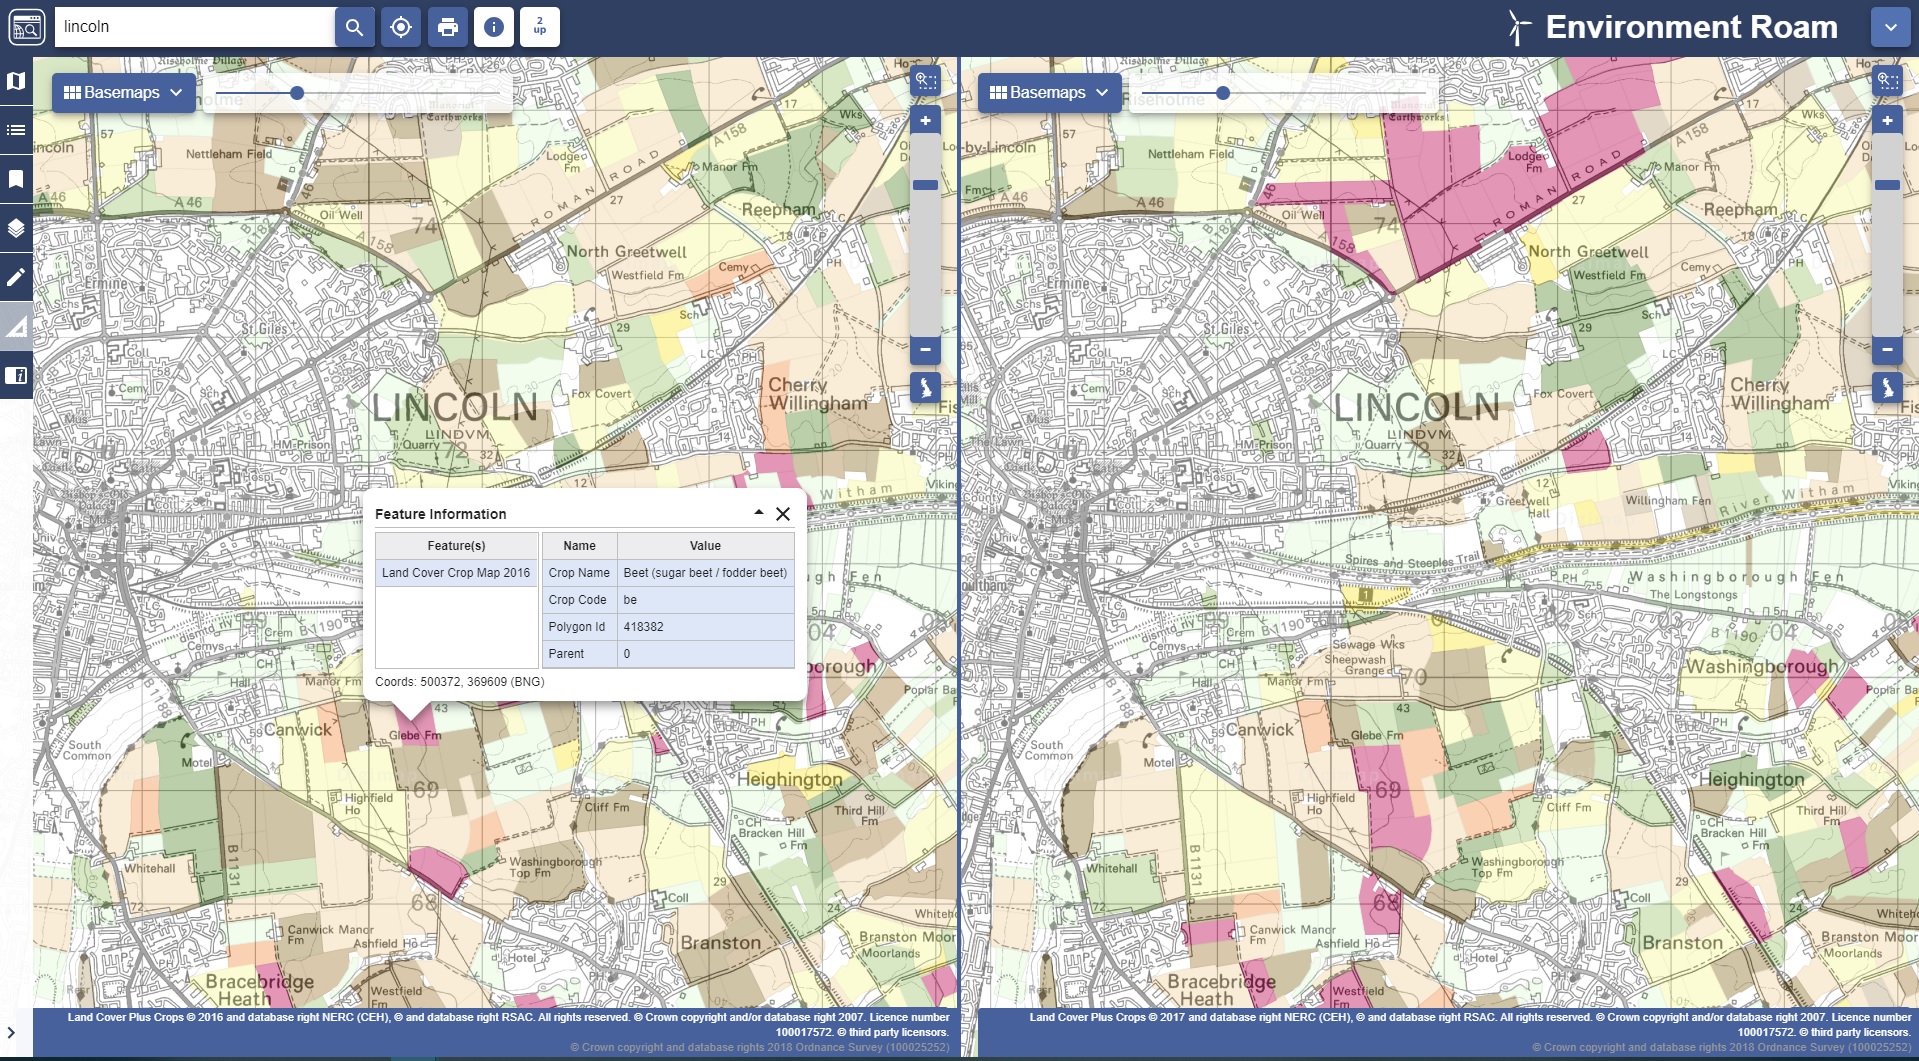
We are delighted to announce that Environment Digimap now offers the CEH Land Cover® Plus: Crops dataset. CEH Land Cover® Plus: Crops has been produced by the Centre for Ecology & Hydrology in partnership with Remote Sensing Applications Consultants and provides annually updated arable crop information for the whole of Great Britain.
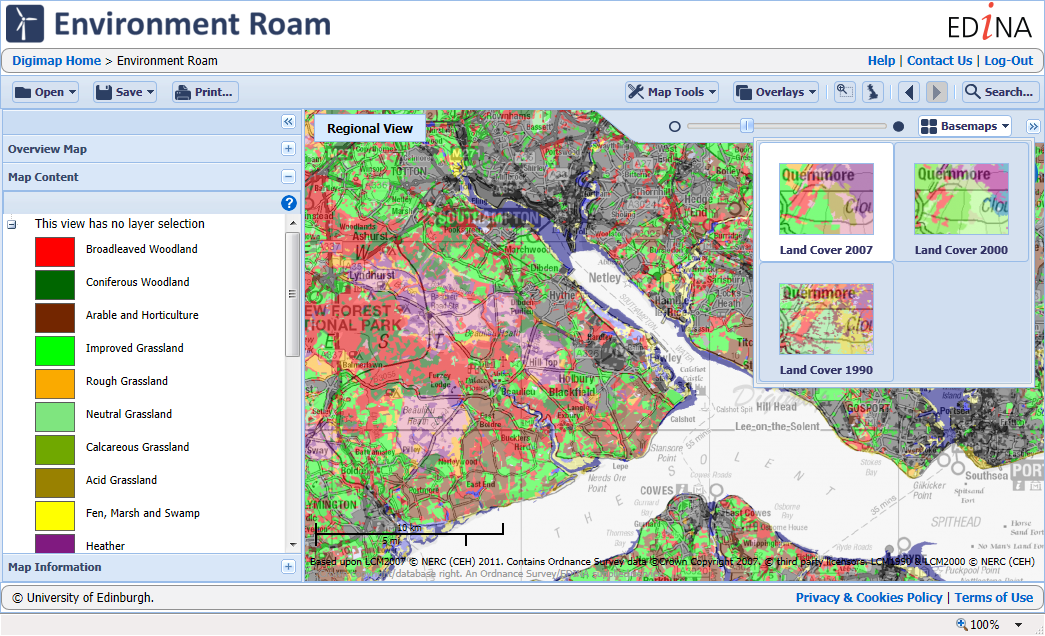
Environment Digimap is the only platform dedicated to the academic sector offering this data. CEH Land Cover® Plus: Crops data is available for both 2016 and 2017. Environment Digimap’s Roam application has the new datasets displayed as alternative basemaps, allowing you to compare the two years side by side using the “2-up” map function. The opacity slider also enables the underlying context map to be viewed easily.
The Info Tool also enables you to query the Crops data, giving information about the crop name, code, the polygon identifier and the coordinates of the point chosen. All other functions in Roam operate as usual, including the ability to annotate measure and print. The Map Content is also available in the left hand panel to help you identify crop types.
The CEH Land Cover® Plus: Crops data is also available to download from Environment Download. Select your area of interest as usual, add the Crop data to your basket and select from File Geodatabase or GeoPackage as optional formats. You can also choose to select individual crop layers rather than the full suite if you wish.
If your institution has a subscription to Environment Digimap, this dataset is available at no additional charge. If your institution does not have a subscription to Environment Digimap, prices and details of the subscription process can be found on our website.*
*Please note that in order to place a subscription order you must be a suitably authorised member of staff. If you have any questions about this, please don’t hesitate to contact us.
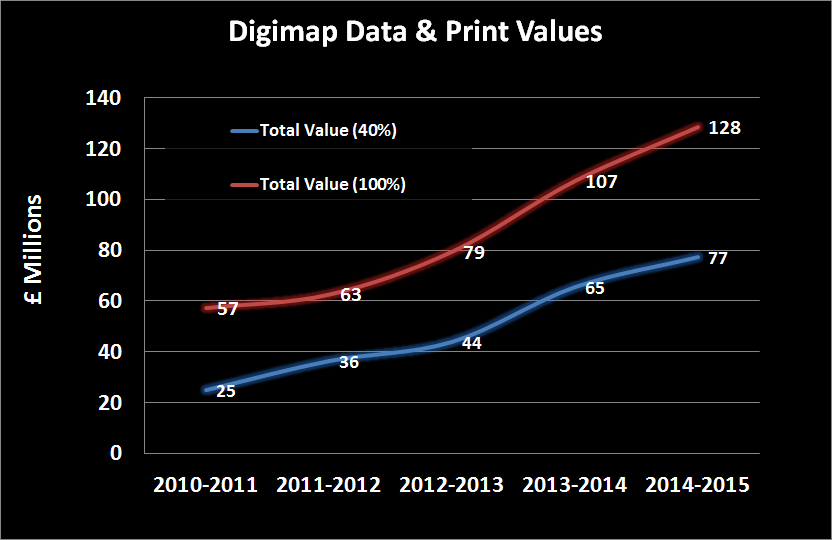
EDINA has again calculated the commercial cost of all the data downloaded and maps created for printing in all Digimap Collections for the period August 2014 to July 2015. This was done per subscribing institution and then totalled; the grand total is approximately £77.25 million. This estimate is a conservative one because we reduce the quantity of data downloaded by 60% to account for duplication of usage. When all the maps printed and data downloaded were included in the calculation (i.e assuming users would continue to take their own data and maps, and not share them) this total rises to almost £128.5 million.
Click to enlarge image
We know that some data is downloaded multiple times within an institution, for example by students during a class exercise or by individual researchers working on the same study site. We found that on average only 40% of the data taken from Digimap over a period of time was unique within an institution. We believe that if institutions were paying commercial rates for their data they would be more likely to download it once and circulate it to those who need it; this is why we reduce the amount of data included in our calculation. However, there is considerable variation between institutions as to how much is unique; those that do more research or are smaller in size tend to have a greater proportion of unique downloads (i.e. fewer people downloading the same areas, for example, for the same study site), so we have included the 100% figure as a ceiling value.
Click to enlarge image
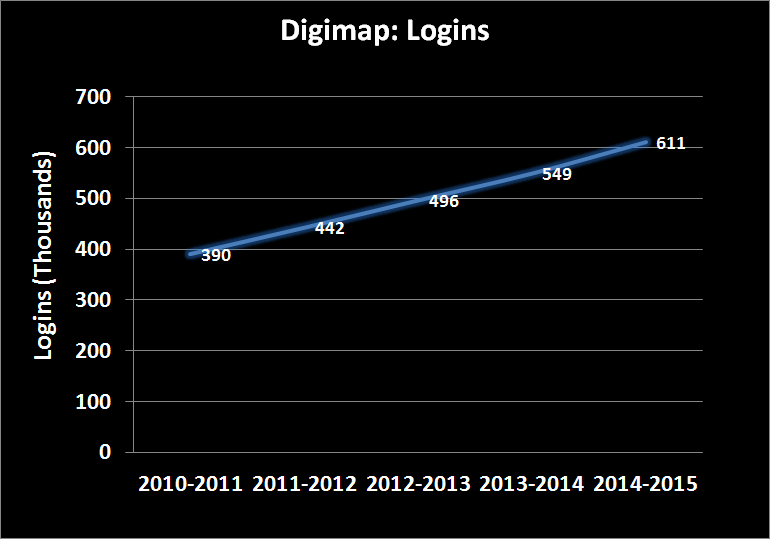
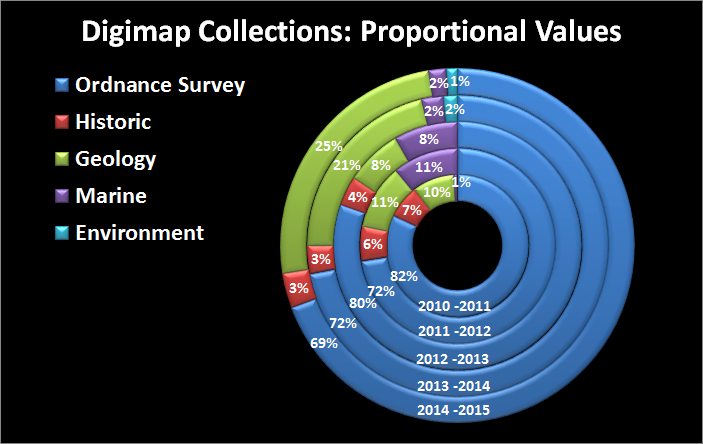
In total, over the past five academic years over £435 million (£248 million at 40%) worth of print maps and data has been served up from Digimap to subscribing institutions. The steep increase in 2013-14 was caused by more Ordnance Survey products being downloaded and printed than ever before and also by the high commercial costs of several products added to the Geology Digimap service. The upward trend in the total commercial costs has continued in 2014-15, though at a steadier rate, however we are seeing the same year on year growth in the number of logins to the service.
How the Costs are Calculated
Click to enlarge image
The costs used in our calculations for the data are sampled from the list prices published by a range of data suppliers, and include any relevant multipliers or discounts declared publicly on their websites.
Each data product is assessed individually because many are priced differently. The obvious example is OS MasterMap, which is charged on the basis of the TOID density per square kilometre. TOID density changes according to the area mapped. Each product is price-checked annually against a range of suppliers.
We calculate the values on a per product / per institution basis, with the data preparation and licensing charges assigned only once per product, per institution (rather than per data request). Many of the data collections are commercially licensed based on the number of users who have access to the data; with increasing numbers of users a multiplier is applied to a base cost. We applied the relevant multipliers according to the number of active registered users for each Collection at an institution.
We capped data costs at the price of national coverage for each product, making it impossible to assign greater cost for any one product than it would be to supply the entire dataset for use by a whole institution.
The values for the print maps (including saved maps in all Roam applications) are calculated by finding the cheapest commercially available map prints from websites such as eMapsite, NLS and FiND.
What We Didn’t Include
Click to enlarge image
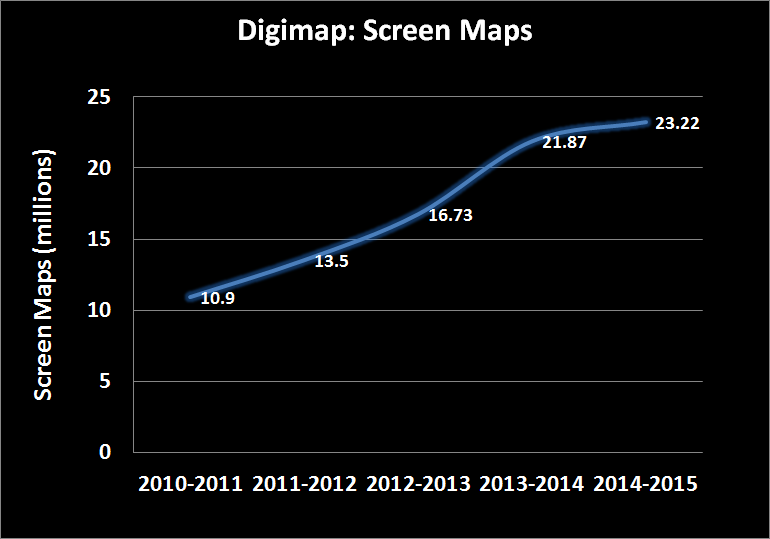
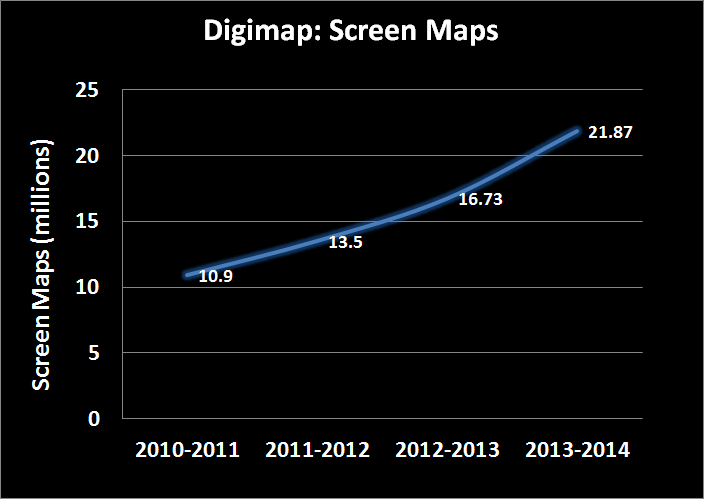
No monetary values were assigned to the millions of screen maps that are produced from Digimap. The value calculated also doesn’t take into account any of the help materials, training courses and support facilities that are all part of the Digimap service. Many commercial service providers may charge an additional fee for this part of the service.
All OpenData products (both prints and data downloads) are excluded from the calculation, despite the advantages of producing them from Digimap over other websites.
However, the biggest saving that isn’t included in these value calculations is your time. We only charged the data supplier’s preparation and licensing costs once per product or order, in line with each company’s policy where it applied. In reality there would be many orders occurring throughout an academic year as new research questions are raised. This all costs time, time spent submitting data requests and waiting for them to return; time to create and manage a repository for spatial data; time to acquire the knowledge on how to use the data you receive. Commercial providers mitigate these delays but may charge fees for the convenience. By providing 24 hour access to high quality data, customisable maps and detailed support materials through purpose built interfaces, Digimap saves this time and expense for its users.
Digimap avoids students, academics and support staff having to wait longer than necessary for the information they need and the instruction on how to use it.
We will be sending out each institution’s data cost calculations to Digimap site representatives. If you are interested in the commercial costs of the maps and data your institution has been using please contact your site representative. If you are unsure who your site representative is, please contact us:
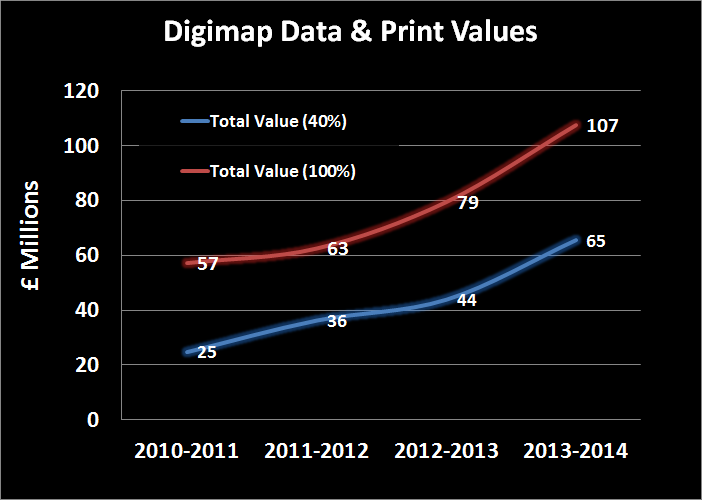
As part of our work to demonstrate the value for money of the Digimap Collections, EDINA has calculated the commercial cost of all the data downloaded and maps created for printing. We calculated the values per institution for the period August 2013 to July 2014 then totalled them; this came to approximately £65.4 million. This estimate is a conservative one because we reduce the quantity of data downloaded by 60% to account for duplication. When all the maps printed and data downloaded were included in the calculation (i.e assuming users would continue to take their own data and maps, and not share them) this total rises to over £107 million.
Click to enlarge image
We know that some data is downloaded multiple times within an institution, for example by students for a class exercise or by researchers for specific study sites. We found that on average only 40% of the data taken from Digimap over a period of time was unique within an institution. We believe that if institutions were paying commercial rates for their data they would be more likely to download it once and circulate it to those who need it; this is why we reduce the amount of data included in our calculation. However, there is considerable variation between institutions as to how much is unique; those that do more research or are smaller in size tend to have a greater proportion of unique downloads, so we calculated the 100% figure as a ceiling value.
In total, over the past four academic years over £306 million (£170 million at 40%) worth of print maps and data has been served up from Digimap to subscribing institutions. The steep increase in 2013-14 was caused by more Ordnance Survey products being downloaded and printed than ever before and also by the high commercial costs of several products added to the Geology Digimap service.
How the Costs are Calculated
Click to enlarge image
The costs used in our calculations for the data come from the list prices published by data suppliers, and include any relevant multipliers or discounts declared publicly on their websites.
The data costs we calculated are done on a per product / per institution basis, with the data preparation and licensing charges assigned only once per product, per institution (rather than per data request). Many of the data collections are commercially licensed based on the number of users who have access to the data; with increasing numbers of users a multiplier is applied to a base cost. We applied the relevant multipliers according to the number of active registered users for each Collection at an institution.
We capped data costs at the price of national coverage for each product, making it impossible to assign greater cost for any one product than it would be to supply the entire dataset for use by a whole institution.
The values for the print maps (including saved maps in all Roam applications) are calculated by finding the cheapest commercially available map prints from websites such as eMapsite, NLS and FiND.
What We Didn’t Include
Click to enlarge image
No monetary values were assigned to the millions of screen maps that are produced from Digimap. The value calculated also doesn’t take into account any of the help materials, training courses and support facilities that are all part of the Digimap service.
No OpenData downloads or maps created from OpenData are included in the calculation, despite the advantages of producing them from Digimap rather than other websites.
However, the biggest saving that isn’t included in these value calculations is your time. We only charged the data supplier’s preparation and licensing costs once per product or order, in line with each company’s policy where it applied. In reality there would be many orders occurring throughout an academic year as new research questions are raised. This all costs time, time which the data suppliers will charge for or that institutional staff would have to take to submit requests for data and time for staff to create and manage a repository for spatial data.
With 24 hour access to high quality data and maps through a purpose built mapping and data download interface, Digimap does all this work for its subscribers.
Over the coming weeks we will be sending out each institution’s data cost calculations to Digimap site representatives. If you are interested in the commercial costs of the maps and data your institution has been using please contact your site represenative. If you are unsure who your site representative is, please contact us:
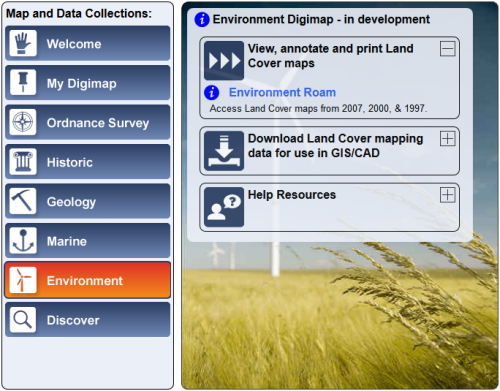
EDINA and Jisc are pleased to announce the launch of a new Digimap Collection, Environment Digimap.
This new collection offers land cover map data from the Centre for Ecology & Hydrology (CEH). Environment Digimap is a subscription service; however, it will be available free of charge until 31 July 2014. After this period a subscription fee will apply per institution.
Environment Digimap offers two facilities: mapping through Environment Roam, and the ability to download data through Environment Download. The data available, CEH’s Land Cover Map products, provide a snapshot of land cover for each of the years 1990, 2000 and 2007. There are raster datasets available at 25m and 1km resolutions for each year and a vector version of the 2000 dataset. The data are in a range of formats depending on the year. More details are available in the Environment Digimap Help Pages: CEH Products Available
How to get access…
To use this service for free your institution needs to subscribe, this is free till the end of the 2013 – 14 academic year and can be arranged via the Jisc Collections website:
If your institution doesn’t subscribe the Environment Digimap button on the home page will be grey. Contact your Digimap site rep and they will be able to help arrange your institutions subscription: List of Digimap Site Reps
If you have any questions about Environment Digimap, please contact us: