Any views expressed within media held on this service are those of the contributors, should not be taken as approved or endorsed by the University, and do not necessarily reflect the views of the University in respect of any particular issue.
Digimap is an online map and data delivery service, available by subscription to UK Higher and Further Education establishments. Operated by EDINA at the University of Edinburgh, Digimap offers a number of data collections, including Ordnance Survey, historical, geological, aerial photography, LiDAR, marine maps, land cover mapping, global mapping and census data. For more information about Digimap go to our website: https://digimap.edina.ac.uk Background image Contains OS data (c) Crown Copyright and database right 2022
Thanks again to everyone who turned up to the event and helped make it so successful. If you weren’t able to attend or would like to remind yourself of what happened, the live blog recorded the main points of all of the presentations: Geoforum Live Blog
The new Data Download has been updated with a few more enhancements that will make it even easier to use; it is now no longer in BETA.
A selection of the improvements made include:
Changes to where you change between panning the map and drawing a rectangle to select to make it more obvious what you are doing.
A general improvement of the lay out and buttons used.
My Account has been moved to the top right of the screen.
Better product information by clicking on the icon.
You can clear the selection you have just made using the button.
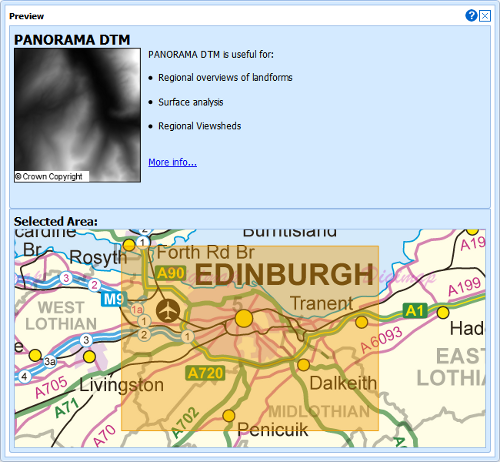
A greatly improved preview of the each dataset in basket, showing what the product is like, what it can be used for, and the extent of the area you are taking:
These changes have been made in response to recommendations from a usability project run in conjunction with the redevelopment of the Data Download service. You can read more about this project, called USeD, on its blog here:
The enhancements also include a fix to a bug that some users experienced when using the latest version of the Google Chrome web browser; the interface no longer offsets the area you select when displaying it on the map.
We will be liveblogging the talks throughout the day so look out for updates to this page during or after the event. As with any liveblog we hope you won’t mind a few typos, spelling errors, etc. If you see something you’d like to know more about or you would like to let us know about a correction then please leave a comment below. You can also join the conversation on Twitter with the hashtag #geoforum.
You can take a look at the programme for the day (which will be gradually becoming headings for our liveblog post) below:
Welcome – Emma Diffley
Emma is welcoming us to the GeoForum. It has been four years since we last ran a GeoForum event so it’s great to get everyone together again. Many of you will have been in touch with the EDINA staff who you will be able to meet in person today, particularly our helpdesk staff.
We have lots of work to show you today, we will also have an opportunity for you to see our exhibitors stands, we have our keynote Professor Dave Martin, and then after lunch we will looks towards the future and developments coming soon, including a talk from one of our Digimap developers.
New Home Page – Guy McGarva
We have been working on this project to create a new homepage for over 6 months. This includes updating all supporting interfaces and support materials. Our project team has had input from our web designer, our software engineers, and we have done usability testing. We are now looking for feedback as we move towards releasing the new homepage.
But why do this? Well the existing collections infrastructure was making it difficult and time consuming to maintain. It was not obvious to users what services we offered and what they had access too. And it wasn’t an attractive front door to our services. So we really wanted to focus on our users and how we could make a more intuitive and appealing frontpage for them in a way that would be much easier for us to maintain.
We did, however need to retain the functionality. We went through various wireframe processes to try to find the best way to retain functionality but improve the page. On our new design we have one page with access to all of the services. The login is presented at the outset to make it clearer to users that they do not have to login but if they do they will have access to more services.
As a non logged in user you can browse the available services, you can access our increasing range of open services such as OpenStream and ShareGeo, and you can view news, alerts, etc. There are still all of the same components as before but the design is much more flexible and we can easily update and more things around whenever needed.
As a logged in user there is a new tab which will appear called “My Digimap” that includes user details, local support information – you, as site reps, can supply this to us and we will add institutional information. Site reps will have an additional Site Rep Support Area on this tab. This area can be personalised for you.
The main thing is still accessing the collections. So we have Ordnance Survey, Historic, Geology, Marine and we have a tab called Discover where we are grouping other related services, APIs etc. and which we can add to in the future. Each of these service tabs includes supporting information to help the user get started with the service and to group all the relevant materials in one place but you only have to deal with the information you need.
On the new homepage we also have a news feed from the Digimap blog as well as links to our social media presences: our blog, facebook page, twitter account, Youtube channel etc. We also have a panel highlighting our geo services. And finally we have an optional newsflash area at the top of the page which we will be using when there is a scheduled downtime coming up or other essential alert to share.
Q&A
Q1) When will it go live?
A1) We hope to have the first release in early to mid July. We will then also be able to do some minor fixes over the summer as needed.
New Data Download & the USeD Project- Addy Pope
I will be talking about a recent JISC-funded project called USeD – Usability Service enhancements for Digimap. The idea was to improve the Data Downloader within Digimap. It is heavily used by Digimap’s 48,000 users. It had over 74,000 data requests in the year from Jan 2010-2011. The existing downloader has been around for a while and we knew that it wasn’t meeting our user needs at the moment.
The workflow was based around a single linear sequence of interaction, it preseumed significant familiarity with ordnance survey, really it was built with what technology could do in mind, not with what our users needed. But we can do better than that now so we wanted to look again at how the downloader could work for our users.
We undertook a process to develop user personas. We went out to interview Digimap users and consider how their usage is grouped. We broke our 25 interviewers down into four groups representing different types of usage, expertise, and usability style. I was sceptical about these personas but building these really lets you understand how they use the service, the wider picture of what else they do, the context for their usability requirements.
Based on this work we were able to understand how our users are thinking when they access our services. As we began to think about how to address this we set up a usability lab – this allowed a volunteer candidate to work through a number of tasks with a facilitator. In a nearby room I was able to view two screens – a web cam of what the candidate is doing and whether they are engaged on one screen, a mirror of their screen on the other. We used a baby monitor to listen to the audio feed from the usability testing. This set up let us only have 2 people conducting the testing which put the candidate at ease.
We provided several versions of the data downloader. Version 1 looks a lot like ROAM and is visually appealing but there were issues. There is a linear process in place here even if it is not obvious that this is in place. But in testing we found that the user was comfortable with linear order.
In Version 2, which we retested, we made a few changes to make a similar design easier to work through. But there were other things to sort out. Odd errors on certain buttons, buttons users were happier and more comfortable using because of the wording used. And so we moved through Version 3, Version 4, Version 5. And eventually, after a lot of tweaks, we reached the final version which is now live.
We have had good feedback so far. You can select multiple data areas, multiple data sets, we’ve increased the download limit. It works better and you don’t have to select by tile if you don’t want to which makes it much more usable for some.
Sometimes you can be overfamiliar with an interface so I recommend the testing process – the usability lab set up can be very inexpensive – and having a developer sit in on this process is hugely valuable for understanding user behaviour.
That’s pretty much all I was going to say today but you can read much more about the project on the USeD blog where we recorded the whole process throughout the project: http://used.blogs.edina.ac.uk/
Q&A
Q1) Can you now select data by smaller areas than before? I remember some tiles being enormous?
A1) It depends on the tile size of the data. You can select only a smaller area but large tiles won’t be split down into others.
Q2) Will this be available for geology and historic?
A2) Geology should be fine. Historic has so many datasets in it that that would be more tricky.
Welcome to the Sensed World! – Ben Butchart
I will be talking about what is called web 3.0, augmented reality, the web of things… I am going to call this the Sensed World.
There has been a huge amount of change through mobiles in the last few years but the key thing to note is that we now carry serious computing power with us pretty much everywhere through our phone – our computer is with us wherever we take our clothes!
You might be aware of the sensor web as a concept. This isn’t about humans but about lots of automated devices. By comparison the sensed web is about humans, about sensing, about geo location, about enhancing vision – the reading of barcodes, the taking of images, etc. But sensors and connected devices are also throughout our home now – the Kinect for instance.
I think the Sensed Web really began in 2008 with the launch of the iPhone 3G. This was the first iPhone with GPS but the 3G, the app store, the application of that GPS data was the big moment.
At EDINA we have done various work with the sensed web – through projects like Walking Through Time, AddressingHistory, Phone Booth and our new exciting project called Digimap FieldTrip GB which allows you to use Digimap data for fieldtrips. You can cache maps onto the device for when you are out of range for networks, you can annotate, gather text notes etc. You can use this with the open Ordnance Survey data. But you can also login to Digimap and get the richer more detailed mapping materials.
So we have had location based services but we are now moving more towards Augmented Reality. This is the joining of the real world and things we wouldn’t normally be able to see – hidden things, small things, secret history, add context to the current location, explore human or building anatomy. Chemistry applications etc.
So examples here include Augmented Sandbox using Kinect and a projector to make a fun augmented reality experience of a traditional physical kids sandbox. Then there is the idea of gesture presentation through a clip of Hans Rosling from BBC4.
The issue we have is that sensor web authoring is really hard – you have to be an expert across multiple technologies and authoring languages and there is no one clear tool that helps you develop for AR. I am working with the International Augmented Reality Standards Group to try and work through some of these issues. And at EDINA we are using that Digimap FieldTrip GB app as a starting point to developing an AR authoring tool.
Hopefully we will see ourselves moving towards augmented lectures. The web may have made the world feel smaller, I think the sensor web is going to make the world feel richer, deeper, with more to explore.
Q&A
Q1) What is the timescale for the Digimap FieldTrip GB app?
A1) We think probably October or November for that. We have lots of material on this at our table here at the back of the room and would love your feedback about what you need, what name you’d like to see this have.
Keynote Address: Open Geospatial Data and the End of the Census: What Next? – Professor Dave Martin
Our keynote speaker today is Professor Dave Martin of the University of Southampton.
What I’m hoping to do today is to look back at the world in the last ten years around the ESRC Census Programme. I think lots of changes around census data mirror what is changing in the geospatial world and that’s why I’ve chosen those two areas for now. And I want to think about pervasive geospatial data, open data, linked data… and I want to consider the loss of certainties. We may have seen the last Census in England and Wales but that data will still be needed and collected so what does that mean. And I’ll be doing this with lots of train analogies as I couldn’t help myself given our location.
Census data is very geospatial, much of the strength of the data is that it covers very detailed, small geospatial areas that can be connected to other geospatial data sets. If I look back at geospatial products things are becoming increasingly detailed. We have seen more detail, we’ve seen that becoming more freely available. We’ve seen the census data being a driver to other geospatial data.
Small area census geography is used in multiple contexts. In location-based, migration. transportation research are all based on census areas. The boundaries and geographical understanding of those areas are from the census, around the collection of census data. And anything requiring a denominator population really depends on the census. But there are limitations on this usefulness since the census only runs every 10 years.
If we look through a number of historical sets of census data we see classic shaded census maps breaking down output areas by particular data. As we get to 2001 we start to be able to use census data online. It is a very basic interface at this point but it was a big deal to be able to do this online and to be able to query the data, graph it. There are lots of reasons why this data is fundamental for what people want to do but… shaded maps are hard to interpret. There are additional issues. Most commonly dependent on traditional census-type data but increasingly there is a desire for different geographies, for location of people in the daytime, not just their nighttime location. There are things we are needing to provide that are not currently possible with the census data.
But it’s all change now… there is increasing interlinking of data sources, particularly in government. Open government licensing wasn’t even conceived of when we ran that 2001 Census. We have various examples here from data.gov.uk to any manner of
So the world is shifting here. Some population data sources are “national statistics” – very clear data, metadata, etc. Some sources are thoroughly documented (e.g. Department for Transport) and we know any limitations. Some sources are demonstrably incomplete – particularly where crowdsourcing comes in (e.g. OpenStreetMap). So we have this rich, diverse but confusing world. So many data souces but each has their own provenance and limitations, not all are comparable.
Even the census data is moving towards this – albeit with old census data. For instance the CASA tool, PublicProfiler, uses census map layers with OpenStreetMap. Similarly nestoria compares census data, openstreetmap, and house prices in an area. Some of the data here is presented in charts like that Office for National Statistics site from 2001 but with that additional context of map, interface, comparison data, it has more interesting context and can be more useful.
So.. was Census 2011 the end of the line? Census day was 27th March 2011. It was a mail out/mail back format but we also did internet data collection. We had a flexible enumeration strategy. The First data will be available in July 2012 and we expect to rely on that data for 12 years. But that whole process is a very costly one.
The 2011 census was broadly similar to the content in 2001. More questions on citizenship, place of residence etc. The web form is innovative, some content is innovative but there wasn’t anything more sophisticated in terms of how data was collected. Although there are tools like InFuse around now – designed to pick up data and run your own queries.
But what has changed here is that the census is getting more complicated to do and there is a retreat from census-taking internationally. Attempts to optimnise zone-based census output geography, carried over into other official statistics – e.g. Indices of Deprivation. There are alternative multiple georeferenced data sets and they can be used to validate the census… but if we have those it’s not surprising that politicians look at that data and ask why we cannot collate this data and do that every year instead of census taking.
We are now working on new ways of collecting personal data, an initiative called “Beyond 2011”. International comparators are already moving away from census. But these alternatives are heavily reliant on data sharing and linkage – they are not neccassarily directly comparable, they are hard to trace. If we trust a complex mixture of sources we have to take very different positions on how we trust and use that data. All of those models rely on mixing of data, new spatial data infrastructures including the address register – this was created specially for the Census that combines several separate UK address lists. The tide is against gathering resources and funding for big censuses.
So what is happening elsewhere? Well France has a rolling census, last full enumeratiob ib 1999. Canada long form became a voluntary survey 2011. the USA has a short form community survey that replaced the long term version in 2010. Austria has a new register-based survey… it’s a changing world.
We have a lot of exciting possibilities around what we could do with Census data but so much is shifting in the landscape. My own theory is that we have had a good quality and cost effective census process. And that census alternatives will eventually become sufficiently good and cost effective to become a better option – but the date when that takes place is debatable.
GeoPlace is the register of addresses that ties postal addresses closely to their geospatial location. That’s worth noting. And one last idea to note is LandScan USA – this is an attempt to compile an understanding of daytime populations in the USA based on existing data sets – employment information for instance. We are just starting to do something similar in the UK in a similar way.
So, if we looked back to 1960 we had digital census data. We are now looking at the biggest change since then. The world has woken up to things geospatial but they don’t always do it how we would have done it, especially with regard to metadata. And there are ethical and public acceptibility debates to come. Licensing will remain an issue but how that works may change.
The general trend is richer data, but increasingly from unconeventional sources and needing new methods.
Q&A
Q1) You seem to imply that metadata is old hat, that something will replace it?
A1) I didn’t mean to imply that that metadata was old hat exactly. A lot of the alternative census data sets come from administrative systems. The moment you move from a purpose built database for the census you are reliant on the motivations of the data collector. The Scandinavians took twenty to thirty years to improve administrative collection of geospatial data so that it could be combined with other data sets. We have to think carefully before combining a known and an unknown data source.
Now onto the Lightning Talks, short talks from our suppliers and partners:
Cadcorp are an independent British GIS software company, active in GIS since 1995 and we work with UK, Japan and European markets. Our relationship with EDINA is as a supplier. In September 2008 EDINA announced that it had chosen our server software, GeoSys, and our GIS product to work with data.
Landmark provide historic mapping, including town plans, that are used in the Historic Digimap service. But that is only part of what we do. We manage data from multiple different suppliers, we do data warehousing and hosting for Department for Energy and Climate Change, Sport England etc. We hold data ourselves, we host data from others. We already get some requests through from Digimap users for specific datasets. Even if data isn’t in Digimap Historic you are very welcome to just make a request, get in touch, ask us for data that we might have, etc.
I am the Higher Education contact for ESRI UK. I wanted to just show ArcGIS online. An interactive web maps and apps site which you can register for as an individual for free and then upload and overlay your own data on top of these maps. You can bring in CSV files, Shape and GPX files, and you can use this with your own WMS if you have one. We are interested to see what can be done, what might be useful. We think it might be good for embedding your maps, for using maps on your mobile devices, for field trips (with web access), or for introducing these concepts to students.
ArcGIS Online subscriptions for Higher Education will be established soon, it may even be free for some of those on the top tier of our CHEST agreement. Get in touch for more details.
Two quick sales pitches first. We are a research organisation, if there is something that isn’t in Geology Digimap already just let us know and we are usually happy to share that for free. And we just launched a new app called MySoil.
But I wanted to focus on 3D mapping that addresses geology but also geographical information. The Geological Survey has moved from handdrawn maps from 1820 to the modern era where we use Map and DTM, with Boreholes, with cross-sections to produce a fence diagram, a geological block model, and an exploded model, synthetic sections, etc. In the EDINA agreement you can use 3D models for Edinburgh and London and play with those right away.
We have also made available our modelling software, GSI3D, which you can trial for free for academia, to build your own geological models. For instance this is useful for asset management, e.g. pipelines.
We were established in 2004 and acquired by HR Wallingford in 2010. We are driven by user requirements in digital marine data and GIS. Our objective is to provide Marine Geographic Information Solutions. We don’t believe traditional data meets these needs – charts are for navigation with varying scales, inconsistent content. Often there can be errors to ensure safety (e.g. underestimating depth to avoid ships accidentally grounding). And there is no interoperability with other data sets.
We have created a vector product called Hydrospatial with 6 topic layer data and this is currently available in Marine Digimap. This data has been used, for instance, in offshore wind supply contexts.
We use TruDepth grids but how do we build this model? Well a number of surveys are taken at any one point at any time but how do you select the best available survey? We do this based on type of survey, time and density of data. The result is a seamless surface and 3D image. You will see that survey data is smooth and detailed, chart data can be more pixelated. Survey image is much more details. If you compare the same area mapped in both ways you can see a clearly more detailed view from the survey data. That data can also be applied in other contexts. We comply with metadata standards and the INSPIRE Directive.
This is a JISC-funded project led by a partnership of the University of Portsmouth and our technology partners Klokan Technologies.
The website will detect your location as you access it and will try to find maps in the collection from that location. You can scroll through the 80,000 maps in the collection if you want. Clicking on the map lets you view a thumbnail and clicking again you can go through to access that map. We don’t host the map, it’s a pure portal. But it is a smart portal. If you zoom in it will filter to more detailed maps a appropriate. You can also search globally – so you can search for New York maps say.
It’s a very simple facility so go and try it out. It is very much about maps held by libraries and exploring those. We are keen to add additional collections. We launched the portal early into the project but we are continuing by working with map librarians. We want to add more maps into the site, we want librarians to see georeferencing as a routine part of the map scanning process. It adds small cost (20-30%) but hugely increases the utility of those maps to others. We hope that we will also be able to make map URIs that are stable and quotable long term rather than URLs that will change depending on the viewing software used. And finally we want to include geo-referencing in exposure of library metadata so that these can automatically be harvested.
And the final part of this project is a meeting in Edinburgh in December that will bring map owners and users together. This workshop is called “Working Digitally with Historical Maps” at the National Library of Scotland on Thursday 13th December 2012. We can’t pay expenses but it’s a free day so do come along.
Landmap is based at Mimas, the sister Data Centre to EDINA. We have aerial photography data, we created our own service from a research-led place. We do not have complete aerial photography or the UK but we are aiming to have complete infrared photography – for mapping greenery, trees, etc. That is possible because the data is available. We have metadata from a German supplier. We have some information in competition with Ordnance Survey, in particular UKMap – currently only available for London – which is like MasterMap on steroids with the height and age of buildings, occupants of buildings etc. for M25 area. We have building heights for all conurbations larger than 25,000 people, and building classifications (of 93 types) for a more limited number of sources. Come and collect a postcard or leaflet from our table.
At this point we broke for lunch and an opportunity for our in-person attendees to look around the 15 exhibitor stands at the forum which includes EDINA projects and services and all of our partner and suppliers who were featured in the Lightening talks.
For the next part of the day the group is splitting into two. In the main GeoForum room we will be viewing a series of Project and Services presentations/demonstrations. This will be the strand we are liveblogging. In the second room we will be running a Support Workshop on Digimap. We won’t be liveblogging this but will be using the discusssion and notes taken to feed back into our ongoing developments.
Project and Services Demonstrations
James Reid is chairing this strand of presentations which will look at projects and services, many of which have their origins in various bids etc.
AddressingHistory is a project, phase 1 of which was funded by JISC Rapid Innovation funds. The project was led by EDINA working in partnership with the National Library of Scotland with support from other organisations including the School of History, Classics and Archealogy at the University of Edinburgh and Edinburgh City Libraries.
The project hoped to built an online crowdsourcing tool which would combine Edinburgh’s historical Post Office Directory with georeferenced maps from the appropriate eras. The directories are the most popular resource in city libraries and have huge usefulness for those engaging in local and genealogical research. The names and addresses from the directories were georeferenced through a geoparser, with various degrees of accuracy, and presented in the context of the historical maps.
The directory data is in the public domain so we have been able to make the website and directory parsing tool under Creative Commons licence. The project uses OpenLayers for the mapping and data is held in a PostGres database. Now that the initial georeferencing has taken place any user can go in and edit and correct an entry via the website by moving a map pin, comparing this to the scanned directory, and/or editing the OCR’d text. We also have an API allowing the data to be used and combine with other materials. The site and API launched in November 2010 and was accompanied by lots of social media amplification to engage the local and family history community in particular. The site is free to use so please do go and take a look.
We are just coming to the end of our phase 2 work, internally funded by EDINA, to further develop AddressingHistory. This involved significant changes to support spatial searching, to better associate map pins with search results and particularly to better support entries with multiple addresses. We also have an Augmented Reality layar allowing you to view this data against the modern day locations – that can be used on pretty much any phone via the Layar browser app.
This project has been about crowdsourcing at three levels – at the POD entry level, at the directory parsing level – we have made our code available under open source licence so that anyone can adapt, edit, contribute back to the project. This is particularly important as there are so many PODs – well over 700 just for Scotland that range frome the 1770s to the early 1900s – and they all have unique formatting issues.
We will be launching a wider range of POD coverage soon, bringing in Glasgow, Aberdeen and additional Edinburgh PODs. And we are looking at sustainability – how new PODs can be added, how we can help the site to fund itself, etc.
I will be giving you a brief overview of a service we run called OpenStream. This is an Application Programming Interface (API) to an EDINA Web Mapping Service which provides Ordnance Survey OpenData mapping products for use within the UK academic community. We’ve been running it for over a year now and over a 1000 people have registered for the service so I will just be saying a wee bit about it and how you might find it useful.
The reason for setting up OpenStream was to allow use of the open OS data without the overhead of downloading and managing data directly. You can also use that WMS directly in many GIS to provide the background mapping without the need to download data. It is free to use but we ask you to register so that we can give you an API key. It’s a very simple registration providing immediate access. You need to provide a .ac.uk address (or contact us as in some cases we are able to also provide access to others) and you will be given your own key.
The website includes lots of help and advice about using OpenStream, snippits of code, examples etc. It’s an OGC WMS which means it’s standards compliant. You can use the data for many purposes, we only require that you attribute the data appropriately.
To use the WMS in a GIS you need to supply a number of required parameters and you can optionally provide additional parameters. The OS OpenData products are included here: GB Overview, miniscale, 1:250,000 colour raster, VectorMap District Raster, OS Streetview. You can request either a single layer or a stack of all layers. These are available in a variety of projections. There is a good range of scales here, except of course for the very large scale mapping.
When you use OpenStream in ArcGIS you can enter the WMS and then interact with the data through the ArcGIS interface. Similarly you can use it in QGIS, Google Earth, ArcGIS Online etc. You can also use the OpenStream WMS to embed OpenLayer dynamic mapping.
Have a look at the website and if you have any questions let us know.
Q&A
Q1) Currently when you switch between zoom levels it can be a bit restrictive, perhaps your scale bandings could be a bit different?
A1) We can have a look at that, we have tried to accommodate different screen resolutions and zoom levels to ensure the best display quality but we can have a look at this.
GoGeo started out in 2001 as a feasibility study for a portal for geo metadata. It launched in 2003 and we’ve very much been trying to create a spatial data infrastructure for metadata.
GoGeo is an interface designed for UK academia for search and discovery of spatial metadata. The website includes a significant range of GIS resources – we have gathered around 3,724 items across multiple themes, and news items. We try to keep this up to date and it can be hugely valuable. We cover events, tools and specific softwares, books in this area, and we have a GoGeo blog to cover various geo presentations, developments, etc.
We also have a metadata section including AGMAP – the UK Academic Geospatial Metadata
We have resources on metadata – including a video on YouTube – and a learning module on metadata and field data. We have run 37 metadata workshops across 24 disciplines associated with GoGeo now. And we have a biannual newsletter that covers what happens in the world of geospatial metadata.
GoGeo also includes a search for spatial metadata that looks out across a huge range of databases, networks across the world in three major areas. The GoGeo Portal Catalogue, the data.gov.uk space and INSPIRE materials. GoGeo is intended to be a one stop shop for this sort of data. The whole idea of this is to find, access and be able to use geospatial data.
GoDoc grew out of an awareness we had for the need for a Geospatial Metadata Editor Tool, something to facilitate data sharing, data management, data sharing. The process is as simplified as possible to make it easy for the user to create metadata for their work. You select the country your data is for, can select the geographic extent, and offer a number of fields (16 of which are mandatory) to describe the data, many of these fields are drop down boxes so they are particularly easy to complete. And the editor allows export of the metadata in INSPIRE, GEMMA, and a number of other standards compliant formats. When your record has been created it can be shared publicly or privately – you can create records shared with a peer group, an institution, a research group, etc. We can set up these private nodes because we are well aware that many people will only want to share data with some.
ShareGeo Open, which grew out of a previous project called Grade, which allows the sharing datasets. We need to get more data sets contributed but even with a relatively small collection we see high usage here. You can search the datasets by a geographic bounding box and then when you identify the useful data you can download and use it. Similarly it is easy to share your own spatial datasets through ShareGeo. There is also an ArcGIS plugin to allow you to publish to the ShareGeo portal from within the GIS software.
Unlock is another aspect of the academic geospatial infrastructure we have been building up over the years.
Unlock allows you to access gazeteer information and georeferencing tools all through RESTFUL APIs. You may know Unlock by it’s previous incarnation of GeoCrossWalk. The service is now all based on open source data and that is opening some really interesting possibility.
A team called Project Bamboo contacted us, commented on how much they liked Unlock Text based on our geo parser, which EDINA have been developing for years with the Language Technology Group at the University of Edinburgh, But they had some suggestions and criticism about the interface and API. We have made lots of developments to address those concerns to make Unlock more usable and useful.
The GAP/Pelagios work, focusing on research in the Digital Humanities around classics and archeology. Our text parser is very good but you do get some false positives, some issues, around 15% errors. Pelagios had heard about our work with Bamboo and asked to work with us – this sort of work with outside projects is helping us really improve that accuracy rate.
Similarly we have been working with a project on Anglo-Saxon Stone Sculpture, the researcher behind this asked us how to be Unlocked. Much of what Unlock does you can do through other tools, or you can begin to do through just adding some geospatial field to your database. And then begin to compare that data to other data.
One of our recent projects, CHALICE, has been looking at the English Placenames Survey. We did a pilot project with post-OCR text, mining place names, dates, etc. And this work was enough to convince JISC to fund a full project, DEEP, to build a rich gazeteer of 1000 years of English Place Names. The text mining is part of the digitisation process here which allows OCR errors etc. to be corrected quickly.
A lot of government and public sector bodies produce area-based datasets. When you are looking at this sort of data you want to be able to quickly view and interrogate that data. Thematic Mapper is a way to create Choropleth map online with any of these data sets.
The example I’ll use here is with data on fuel poverty – this data is available from the Department for Energy and Climate Change. The DECC provide regional data as an exel file. The application we have built required that you convert this spreadsheet to a CSV file (quite simple within excel vis Save As… menus).
The next step is to access Thematic Mapper, currently this is through the UK Borders website. You select the file you wish to upload, the application will validate that file to ensure no issues that could cause problems later on. When you are happy you have to specify the geography those variables are mapped for. Then you select which attributes you want to map. When you have done that you get a screen allowing you to classify data, to edit colour coding etc.
This is a simple way to take a CSV and create a Choropleth map. The user can also manually classify the map, to create a print version of the map, and you can download the shapefile. One issue when you normally download shapefile is how to replicate the symbology offline. So we use a standard XML based system that allows this. You can use the same symbology online and offline. Anyone can view that map and learn from the XML what that shapefile mean.
This is currently available for Boundary-Line data (used by unitary authorities, etc) but we hope to soon enable this for any of the UK Borders boundary data sets.
James Reid is now summing up – this session was about showing that we offer a wider variety of services than Digimap and we would encourage you to explore these and the wider academic spatial data infrastructure we’ve been building up.
Future Developments 2.5D – Andrew Seales
I am going to be talking today about 2.5D height mapping, which is a new feature planned for Digimap Roam. But what is it? Well it is the combination of a height map and a topographic map. It has a 3D look and feel but isn’t true 3D.
You would be able to use height data to create these views. The technology here is HTML5 Canvas, WebGL (for Chrome, Firefox, Safari) – this is a really nice choice but not available for Internet Explorer, and JavaScript 9 for Internet Explorer.
So the idea here is that you would find a particular area to visit, you would click a button at the bottom left and this would open up a 360 degree view with the ability to rotate, move, etc. that model – for instance viewing Edinburgh Castle say. And you can do this with geological data as well as rastor maps. And if we look at Ben Nevis we can see a lovely complex contour map of the area. Similarly the geology here helps you visualise and explore the area in a very engaging way.
Once you have selected your favourite view of that model you can click a link at the bottom of the window you can save the view as a normal image that you can use in documents, save on your desktop, etc.
These images work as very acceptable but relatively low resolution renders – this has been a choice between quality and speed. At the quality we will be providing we can render these views quickly on the web which makes it very easy to use and explore data.
So, that’s the idea of what we will be adding to Roam over th enext few months
Q&A
Q1) What is the compatibility for OpenGL and Opera?
A1) I think Opera does support it. Chrome and Firefox allow this by default, in Safari you specifically have to switch that on.
Q2) Is this available to reuse with other datasets?
A2) It uses WCS for the height map and WMS for some of the other data. We probably wouldn’t allow arbitrary data sets to be loaded in but could allow some custom datasets.
User Feedback – Tom Armitage
Yes, I am going to talk about surveys. In winter 2011 we ran a user survey and had over 8000 responses. This has been hugely useful even with a few incomplete/spoiled returns. I will be talking about some of this data but you can have a much further look at the data on the EDINA website here: http://edina.ac.uk/impact/.
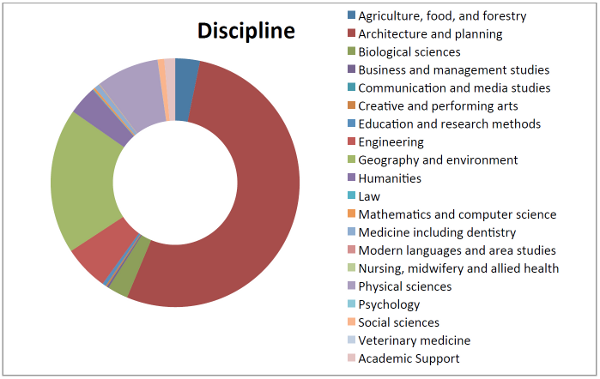
We have taken the data and split it into the old Intute subject areas and this has helped us realise how huge the usage of our services is amongst students and researchers in architects. But the general theme here has been that usage of Digimap takes place across a wider range of subject ares though science and technology subjects are our biggest user group.
Survey respondents did feel that Digimap saved them time, that they would recommend it but they had mixed views on how easy to use the service is.
Issues reported included dissatisfaction with waiting for maps – we looked into this and have made some changes that would be more forgiving of smaller bandwidth by shrinking JavaScript and Compressing images.
Printing was also of concern, particularly around previews and legends. Our solution here is going to be through a new interface with a testing and development process similar to that outlined by Addy for the Data Download developments.
Complex Interfaces were also a concern – the problem being around MasterMap Download and Carto, we are solving this through the new data download, Roam+ and USeD.
Registration was seen to be complicated and slow, we are working to ensure that this is more streamlined, particularly for those who have already registered with one element of Digimap.
We have used other feedback from the survey to help us build up our priorities for the future around Print interface enhancements – new functionality, 2Up and formats; a wider variety of download formats – long term we will probably be looking at some sort of translation process at the point of the user requesting data; Mapping and GIS Support – we think the new home page helps here and we are building up a one stop resource area; New datasets – we are continually looking to add to Digimap so do keep an eye out for datasets being added.
We can take a while to address all user concerns, this is because we serve an incredibly broad range of people from across academia. We have had 2.8 million logins and generated 50 million screen maps since launching in 2000. But there is more we can do here, we are listening to you, and you don’t have to wait for us to put out a survey – we are always happy to hear from you!
You can email us, tweet us, find us on Facebook, comment here on the blog, find us on YouTube – and let us know if you ever want to see anything specific featured in these spaces!
Q&A
Q1) I need better usage stats to justify my subscriptions in my institution, can you provide these?
A1) If you request them we can provide you with statistics, only to departmental level. If you email us we can try to match your requirements. There is some information that we cannot share for data protection reasons but a reasonable amount and type of statistics we can provide, or plan to provide in the future.
One thing we did do as part of the survey process we did work out the value of the data downloaded in the last academic year for each individual institution. That comes with lots of caveats but we will be emailing your institution’s estimate to you, as site reps, soon so that you can get a sense of how well used Digimap is by your students and staff. Across all institutions we estimate that around £24.8 million worth of data has been downloaded in the 2010/11 academic year.
Closing Remarks – Conor Smyth, EDINA
I think the presentations today have really shown that this is a very dynamic area, things change really quickly. We have previously run these events every two years but perhaps in future we should be doing these annually as the pace of change has been increasing and how important and central user engagement is to that process. The USeD project in particular is a good example of how we’ve changed service delivery and enhancement. And Ben’s presentation focused on the importance of fun in education!
I must thank my colleagues in EDINA, particularly my colleagues from User Support for arranging today. I wanted to thank our keynote speaker Professor Dave Martin for a really interesting presentation on this rapidly changing geospatial world. And finally thank you to all of our speakers, exhibitors and to you, our participants today for coming along and sharing your experience and discussions.
And with that we are finishing up at the GeoForum. If you have any comments, questions, requests or corrections related to today’s blog post do leave your comments here. We hope you have found the liveblogging useful and would love to hear your feedback on any of the projects and developments discussed today. You can also expect to hear more about some of those forthcoming Digimap developments here on the blog over the coming months.
It is now just over three weeks till the Geoforum event at the National Railway Museum in York on the 20th of June. We already have close to 60 people booked to attend, with backgrounds as diverse as sports science and medicine through construction to more traditional areas such as geography and the natural environment.
Representatives for: Ordnance Survey, British Geological Survey, Landmark Information Group, SeaZone Solutions, ESRI, Cadcorp, Landmap and Old Maps Online, will all be present to let you know about their latest developments and how their products and services can help you. We have also just released a more detailed timetable for the day, available at the end of this post.
To find out more and book your place at the event go to the website:
For those who may need to justify their travel expenses here are a few reasons why all those who support the use of geographic data and services at their institution should attend:
Reasons for Attending:
Get up-to-date with all the latest geo datasets and services available from EDINA.
Find out how site reps at other institutions are promoting and supporting the use of geo-services.
Learn how some of EDINA’s shared services can be used at your institution:
Embed Ordnance Survey maps in websites with Digimap OpenStream
Search text documents or websites searches for place names with Unlock Text.
Create thematic maps online using your own data, without GIS software.
Meet representatives of the data providers including: Ordnance Survey, British Geological Survey and Landmark Solutions.
Speak to GIS software vendors ESRI and Cadcorp about the latest software developments and how they can help you and your institution.
Programme for the Day:
10:00
Registration with Refreshments
10:25
Welcome
10:30
What EDINA is Working on, including:
Digimap’s new Home Page
Data Download Usability
Mobile Apps and Augmented Reality
11:25
Break with Refreshments
11:45
Keynote Speaker – Professor Dave Martin
12:10
Lightning Talks from our Partners and Suppliers
12:45
Lunch Including:
Service Demonstrations
Visit the stands of our Partners and Suppliers
14:00
Projects and Middleware Demonstrations:
Addressing History
Unlock
GoGeo / Geodoc / ShareGeo
Digimap OpenStream
Thematic Mapper
Support Workshop covering the following areas:
Your top 10 FAQs
How is GIS & CAD used at your institution?
What support do materials you need from EDINA?
How do you find out information about Geoservices?
What else can we do to help your institution use Digimap?
The VectorMap Local (VML) data in the New Data Download service has been updated, it is now current as of April 2012.VML data is currently only available to download in GML format as supplied by Ordnance Survey. However you can download a free converter from Rolta which will convert the GML to Shapefiles or MapInfo TAB files. There is guidance on where to get the converter and some pointer on how to use it on the following help page:
Processing the data for Digimap Roam takes a little longer than making it available for Download, but we hope to have it into service in the not too distant future. Remember that if you want to see VML data in Roam you have to zoom in to the Street View and use the alternative representations to change from the 1:10 000 Raster data to one of the four different VML styles.
Full instructions on how to view VML data in Digimap Roam can be found in this video:
We have updated the Meridian map data in Digimap Roam and Carto. In Digimap Roam Meridian data along with Land-Form PANORAMA contours form the District view.
There are no changes to the cartography or the types of features shown, however the maps are now using the latest Meridian data updated in January 2012.
Don’t forget you can add hill shading to maps using the icon at the top right of the map. The hill shading can really add to the look of your map, and is especially good when you create a PDF.
Booking is now open for the EDINA Geoforum Event on the 20th of June at the National Railway Museum, York. All the details including a provisional programme are on the website: http://edina.ac.uk/events/geoforum2012/
This free event will provide an important opportunity for anyone who supports geographic services, data and software to find out what EDINA is doing with Digimap and our other geo-services.
There will also be representatives from our data suppliers, partner institutions and some of the major GIS software vendors present. The event will a be a great way to get yourself up-to-date with what is happening with maps and geospatial data in Higher and Further Education.
Due the success of the New Data Download we are announcing the retirement of our old Data Download and Gazetteer Download facilities. The new Data Download performs all the functions of the two older ones, which have now been around for many years.
Were not stopping there though as the new Data Download is continuing to be developed and we hope to have a few enhancements added in June. In addition to this the data from Boundary Download will be brought in later this year and eventually MasterMap data will be included. This will allow you to get all the Ordnance Survey Data offered by Digimap from one single facility.
Please note that the Gazetteer Query and Gazetteer Plus services will not be affected.
If you have any comments or suggestions about the new Data Download facility or any other part of the Digimap service then please let us know: edina@ed.ac.uk
Digimap Ordnance Survey Collection Disciplines from the 2012 survey
These reports give an idea of who is using the services, what they are using them for and what their experience of using the site was like. There are a lot of interesting uses of the service quoted in the reports; it was very hard to pick the ones to include from the huge response that we had.
A final thank you to all those who filled in a survey.
Here are direct links to the reports about each geoservice provided by EDINA:
Digimap is getting a fresh new look with a significant change to the home page. The change is being made to make it easier to find the different services within Digimap and to help our users get assistance with the maps and data. To do this we will be adding a new resource centre where we will bring together all of the support and help resources that are available. The resource centre will offer guidance on not only the information available from Digimap but how to use it in GIS and CAD software.
The new home page will show all the different applications available within Digimap before you login, so you can see what else is available, and show what you are using to your colleagues and classmates. There will also be news and blog extracts on the page to keep you up to date with all things Digimap.
We already have some working prototypes and will shortly begin testing the interface on groups of users to make sure it really does make things easier. We aim to have the new page in place later this year; afterwards you should notice more and more elements of Digimap change to the new look.