Any views expressed within media held on this service are those of the contributors, should not be taken as approved or endorsed by the University, and do not necessarily reflect the views of the University in respect of any particular issue.
Digimap is an online map and data delivery service, available by subscription to UK Higher and Further Education establishments. Operated by EDINA at the University of Edinburgh, Digimap offers a number of data collections, including Ordnance Survey, historical, geological, aerial photography, LiDAR, marine maps, land cover mapping, global mapping and census data. For more information about Digimap go to our website: https://digimap.edina.ac.uk Background image Contains OS data (c) Crown Copyright and database right 2022
We have been looking at the results from the Environment Digimap survey so far and would like to thank everyone for their contributions. The survey is still open and we’d really appreciate any more feedback you can give us:
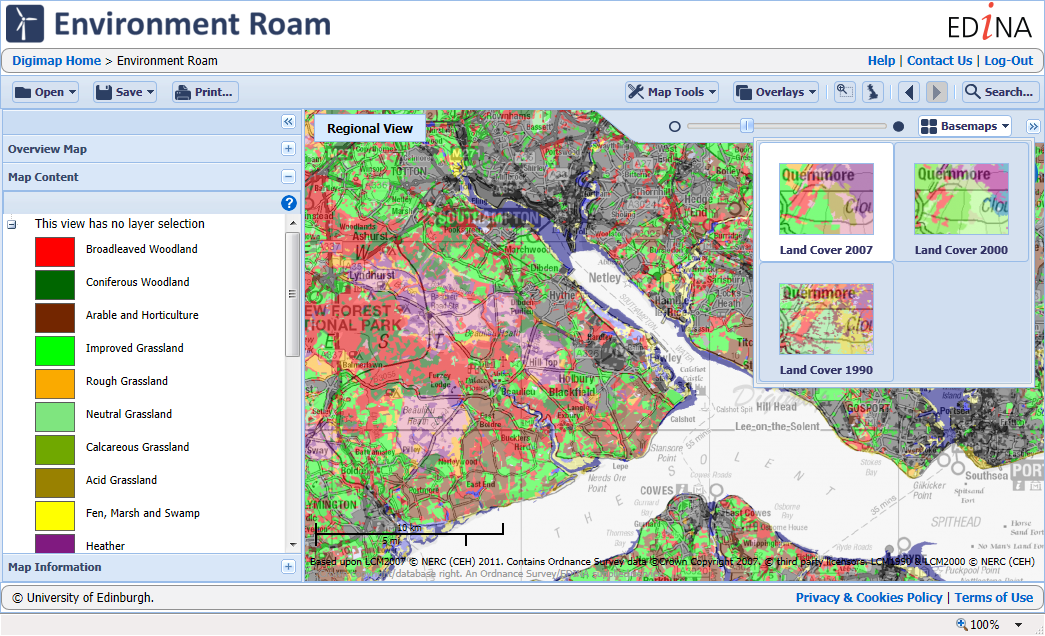
So far you have told us that you are finding the service useful and easy to use. The only concern highlighted was that there is no Info Tool in Environment Roam to allow users to query the landuse at a specific point on the map. This feature is important for those who cannot use the legend and colour scheme owing to colour vision deficiency. Thanks to your feedback we will be prioritising the introduction of this facility to ensure the service is as accessible as possible.
We hope to see further enhancements once the service is established such as the introduction of more data including the 2007 Landcover Data in vector formats. Jisc will be announcing the subscription costs for Environment Digimap in the coming months:
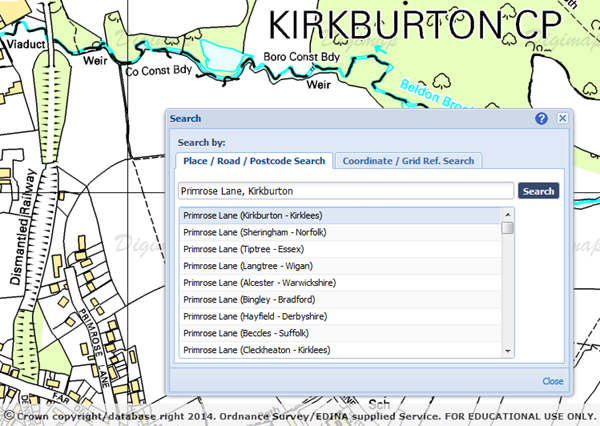
Until now, Digimap has always used the 1:50 000 Scale Gazetteer to provide search results when using the interface.
We have now added street names to the search results in Roam, so you can get more detailed results for your search locations. The locations of the streets come from the OS Locator™ gazetteer which we have been working to include since Ordnance Survey made it an OS OpenData™ product. When using the search interface you can now put in a street name and search for it, though we would recommend adding the name of the place the street is located in too, particularly if it is a relatively common street name. The best results in urban areas are still achieved by using postcodes as these can often resolve to a particular part of the street. However in rural areas where postcodes can be very large, street names can give you the best results.
The search takes all the terms you enter and adds weights to each one; if you enter a full postcode it will just use this to pinpoint your location. If you are not sure your postcode is completely accurate in can be better to leave it out if you have more reliable information. Any street numbers or house names are ignored by the search as these are not stored in the OS Locator or 1:50 000 Gazetteers. The remaining search terms are run against the two gazetteers to produce a list of potential matches.
Be careful when searching for road names that are also places; searching for London Road in Edinburgh will also find Edinburgh Road in London and other possibilities from each city. The weighting usually puts the best match at the top, though you may need to look a little further down the results list sometimes.
We will continue to work on the search abilities in Digimap to improve the results we return, please let us know if you have any questions:
Until now anyone wanting to use OS MasterMap® Topography data in CAD software would have to convert their data, often a lengthy and complicated process. Now you can simply download the OS MasterMap Topography Layer in DWG format directly from Data Download. The DWG data should open in most CAD software such as AutoCAD, Vectorworks and ArchiCAD.
We always knew it wasn’t that easy to convert OS MasterMap data for use in CAD, the conversion software has a lot of options and can confuse at the best of times. The conversion software also doesn’t work on Apple Mac computers which are a popular choice with CAD users. However, we redoubled our efforts to provide DWG format data when we heard that some of our users were making PDF maps of OS MasterMap data and then manually digitising them from the screen… something had to be done!
Incorporating a conversion process into Data Download has not been simple and can produce some very large file sizes, especially if you need data for a busy urban area. Please only take enough OS MasterMap as necessary, or your computer may run out of memory when you work with the data.
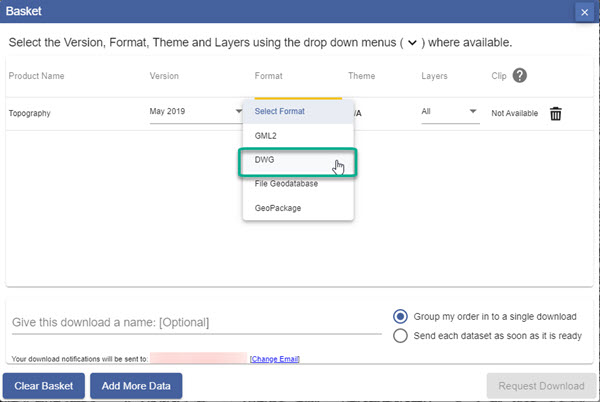
Selecting DWG format
To get your data in DWG format simply follow the usual steps for making an order in Data Download:
Once you have added your OS MasterMap Topography data to the basket, use the drop down arrow in the Format column.
Select DWG format from the available formats.
Selecting a theme and layers
You can select one of two themes for your OS MasterMap topography data. Standard has full colour whereas Plan is in black and white with buildings outlined in red.
Note that you can also choose which layers of Os MasterMap data you wish to download – just select the Layers arrow and check the boxes next to the layers you need, e.g. Buildings, Rail, Roads etc.
Your OS MasterMap data will not need any conversion to open in most CAD software, enjoy playing with the vectors! Please let us know if you have any problems using this data or if you have suggestions as to how it could be improved.
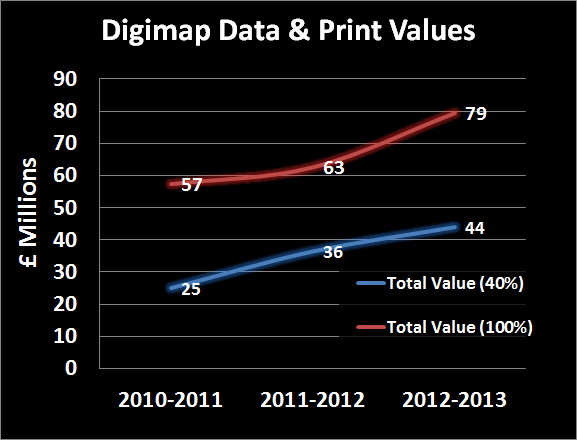
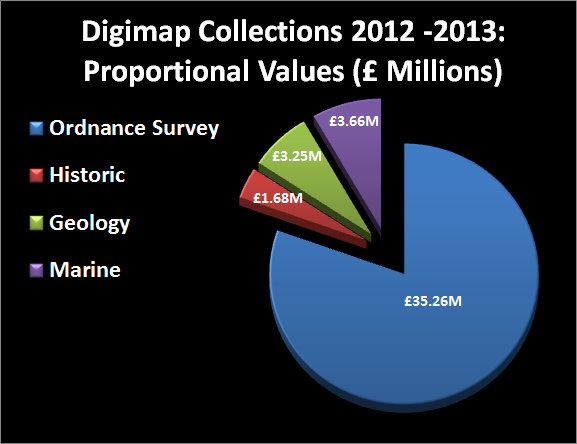
We calculated these values in May so could not include the figures from June and July; we have now added these last two months for 2012-13 to give the full picture.
The headline value has risen from £39.5 to £43.8 million, this significant rise is due to download activity as this period is dominated by postgraduate research rather than undergraduate map printing.
Below are the graphs and charts from the previous blog post updated with the latest figures:
Please remember that there were many caveats to how these figures were calculated detailed in the previous blog post; and that the figures do not include any cost for the millions of screen maps and help and support that comes from Digimap.
These values also do not include the significant amount of time saved by using Digimap over requesting maps and data direct from the various data suppliers. Digimap provides a single place to get the most popular UK map and spatial data resources.
If you are interested in the updated figures for your institution the please get in touch with us:
Email: edina@ed.ac.uk
Tel: 0131 650 3302
2013-14 Values to be even Higher
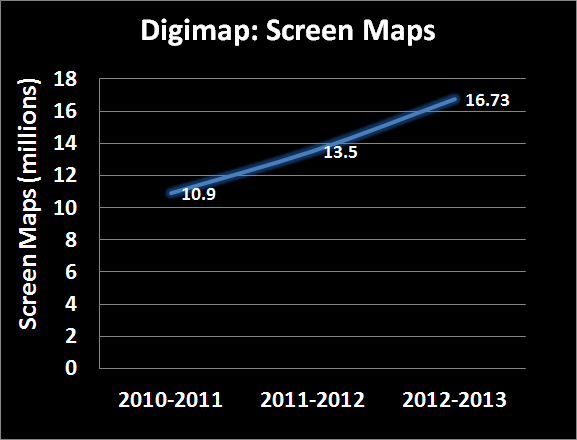
Usage statistics for 2013-14 show that we are more than likely to exceed the figures above; with 5 months to go Digimap has already made 95% of the screen maps that it made in the previous academic year and around 75% of the downloads. We will be recalculating the values once the year ends and hope to publish them in the Autumn.
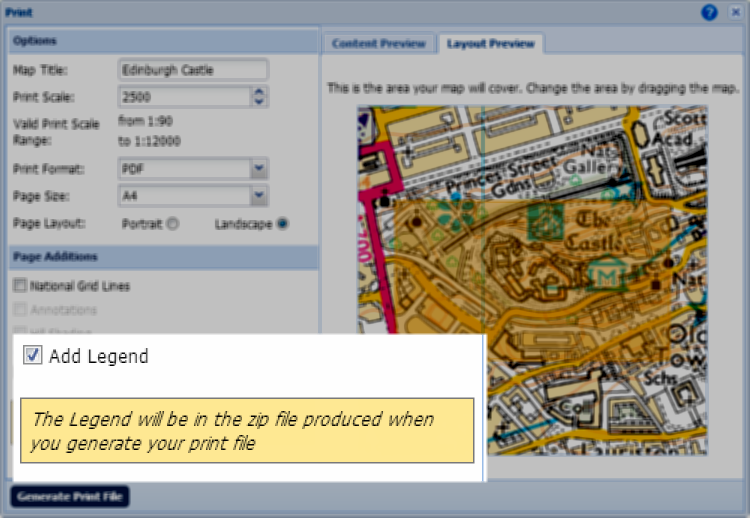
You can now print a legend with your map in Digimap Roam, Geology Roam, Marine Roam and Environment Roam. The legend comes as a separate A4 PDF to your print map and is placed in a zip folder with the map for you to download.
When printing maps that have been customised by removing certain layers, those layers will not appear in the legend ensuring it is as concise and easy to use as possible. Geology Roam goes a step further as its legend filters out any entries for features that are not actually on the map you print.
Legends are particularly important for both the Geology and Environment Roams where abstract colours are used to denote the underlying rocks or land cover. When using the maps online you can use the map content tab or the map information tool to find out what features you are looking at. Now, with the addition of the printable legends, you can reference what these colours represent on the maps printed from the service too.
To add a legend to your print map simply check the box in the interface, as shown above.
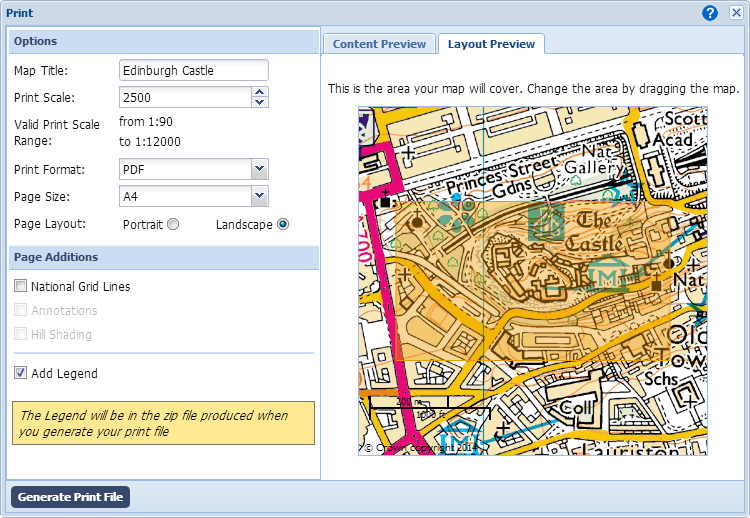
In addition to the legend we have also added a Layout Preview tab to the print interface in all the Roams, including Ancient Roam. This tab allows you to see the full extent of the area you are about to print, very important if you change the scale or paper size. Any changes that will affect the area printed will trigger the tab to flash yellow, indicating that you will now get a different map. Even adding the grid to the map will slightly change the area printed as it requires a wider margin.
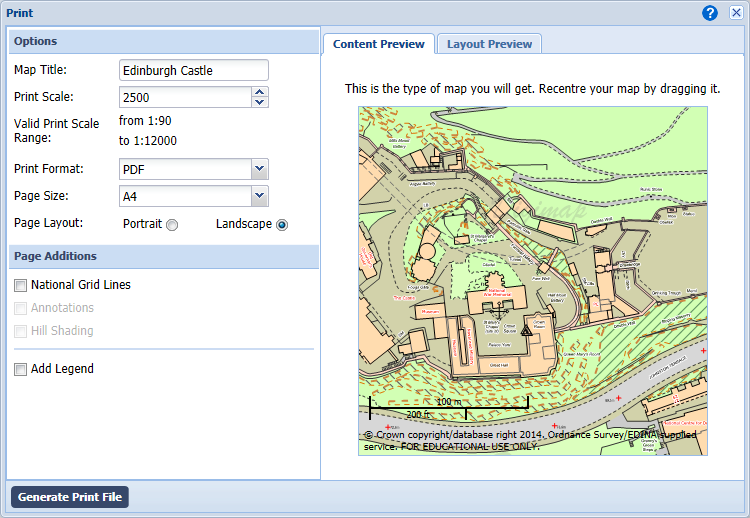
Once you have clicked on the tab you will see the precise area of map to be printed highlighted in orange. You can click and drag the map in this window around, refining the exact location to be printed. As you make changes to the paper size and scale you will see how these also change the area that will be printed.
The addition of this tab will make it much easier to get the right area printed the first time when used in conjunction with the content preview. Remember that the layout preview only shows the area you are printing over a backdrop map for guidance; to see the actual map information that will be printed you need to look at the content preview.
Once you are happy that you have the right map content for the right area click on the Generate Print File button, you will then be able to download the zip folder with your map and legend.
If you have any questions about these changes then please let us know:
EDINA have added data for Northern Ireland to Environment Digimap after an agreement between Jisc and the Centre for Ecology and Hydrology (CEH) to extend the service beyond Great Britain.
The data comprises of 25m and 1km resolution raster datasets for 2000 and 2007 as well as vector data for both these years. The data shown on the right is the 1KM resolution raster data from 2007.
The datasets essentially classify the land into categories including: sea and inland waters, bare, suburban and urban areas, arable farmland, pastures and meadows, rough grass, grass heaths and moors, bracken, dwarf shrub heaths and moorland, scrub, deciduous and evergreen woodland and upland and lowland bogs. These maps can be used to plan, manage or monitor agriculture, ecology, conservation, forestry, environmental assessment, water supplies, urban spread, transport, telecommunications, recreation and mineral extraction.
The Northern Ireland data is currently available from Environment Download only but will be available in Environment Roam once we have created backdrop mapping and search infrastructure for Northern Ireland.
For details about Environment Digimap and how you can subscribe please see this earlier blog post:
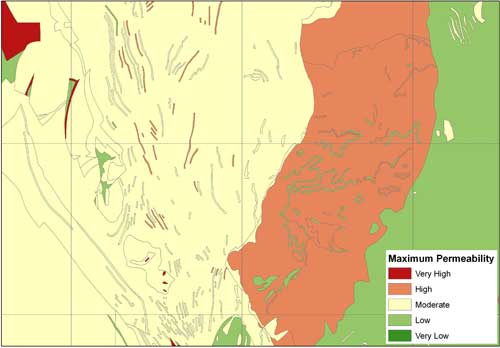
EDINA has added two new datasets to Geology Digimap ahead of the planned release date because of their usefulness when researching floods.
The new datasets have been provided by the British Geological Survey along with several other major products. The Geological Indicators of Flooding and Permeability Indices have been made available from the Geology Download facility early due to the recent flooding events across the UK.
These datasets along with LandCover data from Environment Digimap and digital terrain models, such as OS Terrain 50, from Digimap Ordnance Survey Collection, are all important pieces of information when researching flood risk, causes and potential methods of mitigating against them.
More information about these datasets can be found in the Geology Digimap help pages:
In addition to the two datasets already mentioned there are more new BGS products on the way. You can already download the Superficial Deposits Depth Model and we have the Soil Parent Material data coming soon.
Finally we hope to be integrating the most detailed geological mapping data at 1:10,000 and 1:25,000 scales to both Geology Roam and Geology Download.
If you require any assistance with these datasets or combining them with existing data from Digimap then please let us know:
We are now taking bookings for EDINA’s Geoforum 2014 and with such a fantastic programme this year places could fill up fast. This year’s event will be at the University of Edinburgh in the award winning Informatics Forum, on the 19th June.
Geoforum is a free all day event aimed at lecturers, researchers and support staff who promote and support the use of geospatial data and services at their institution. Throughout the day we there will be talks and demonstrations to inform you of current geospatial developments at EDINA and the wider community. It is also an opportunity to give EDINA feedback on the services we provide and discuss geospatial issues with the team.
For all the details and a full programme please visit the website:EDINA Geoforum 2014
Environment
This year’s theme is the Environment and so we have lined up BBC broadcast meteorologist Peter Gibbs to deliver the keynote. Peter will be talking about the response being taken by the Met Office and Environment Agency to improve flood forecasting.
We also have a recent MSc Graduate talking about his use of LandCover data (available from Environment Digimap) with data from the Scottish Environmental Protection Agency (SEPA) in assessing natural flood management.
Colleges and Further Education
Along with the environmental talks we will also be introducing the upcoming Digimap for Colleges, a new service that sits between Digimap for Schools and the full Digimap service. There will also be an update on all the latest features and enhancements to EDINA’s geoservices.
More Details…
To find out what else we have planned for you, including this year’s excursion, and to book your place please visit the website: EDINA Geoforum 2014
Environment Digimap has been in service for around 4 months now and already has 63 subscribing institutions, over 6000 active users and has made over 35,000 screen maps.
We’d really like to know what you think of the newest Digimap Collection and what you want to see added or improved. Once you have used the service then please go to the following web page and fill in the short survey, it will take less than 10 minutes and will help the future development of Environment Digimap:
If your institution doesn’t subscribe to Environment Digimap yet you still have 4 months where the service is completely free. The following blog post has information on how to subscribe:
For information on how previous Digimap surveys have affected the survey please have a look at the Quality Improvement reports on EDINA’s Benefits of Services page:

 We have been looking at the results from the Environment Digimap survey so far and would like to thank everyone for their contributions. The survey is still open and we’d really appreciate any more feedback you can give us:
 We hope to see further enhancements once the service is established such as the introduction of more data including the 2007 Landcover Data in vector formats. Jisc will be announcing the subscription costs for Environment Digimap in the coming months: