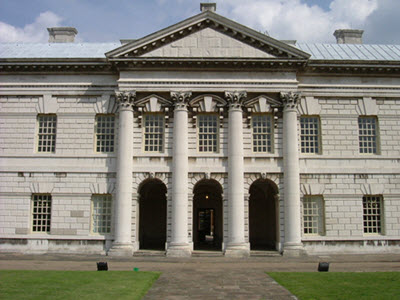
For this year’s GeoForum we were lucky enough to be in the Old Royal Naval College at Greenwich, now home to the University of Greenwich. Around 60 delegates enjoyed a programme of talks and presentations aimed at keeping them up-to-date with the maps and mapping technology available to higher education.
The day began with Professor David Maguire, Jisc Chair, Vice principle of the University of Greenwich, former chief scientist at Esri and an acknowledged expert in computer mapping, outlining his vision of the future of both Jisc and Geographic information science. There was emphasis in his talk about the need to incorporate the Cloud in both Jisc’s services and into the Geographic Data and software services.
- Christopher Wesson, Ordnance Survey – Cartographic Design Principles
- Jason Taylor, Ravensborne – Creating Physical Models with Digimap Data
- Emma Diffley, EDINA – Digimap Copyright and Terms of use
- Guy McGarva, EDINA – Digimap Update
- Ian Holmes, EDINA – Fieldtrip GB Excursion
Cartographic Design Principles
The first full presentation of the day came from Christopher Wesson, one of the founding members of Ordnance Survey’s digital Cartographic Design team.
[iframe src=”//www.slideshare.net/slideshow/embed_code/49964928?startSlide=1″ width=”427″ height=”356″ frameborder=”0″ marginwidth=”0″ marginheight=”0″ scrolling=”no” style=”border:1px solid #CCC; border-width:1px 1px 0; margin-bottom:5px; max-width: 100%;” allowfullscreen]
Cartographic Design Principles – Christopher Wesson
Christopher gave some background about Ordnance Survey and the data they are now creating. He then took us through eight key principles that used to create successful cartographic designs: User Requirements, Display Format, Visual Hierarchy, Simplicity, Legibility, Consistency, Accessibility and Good Composition.
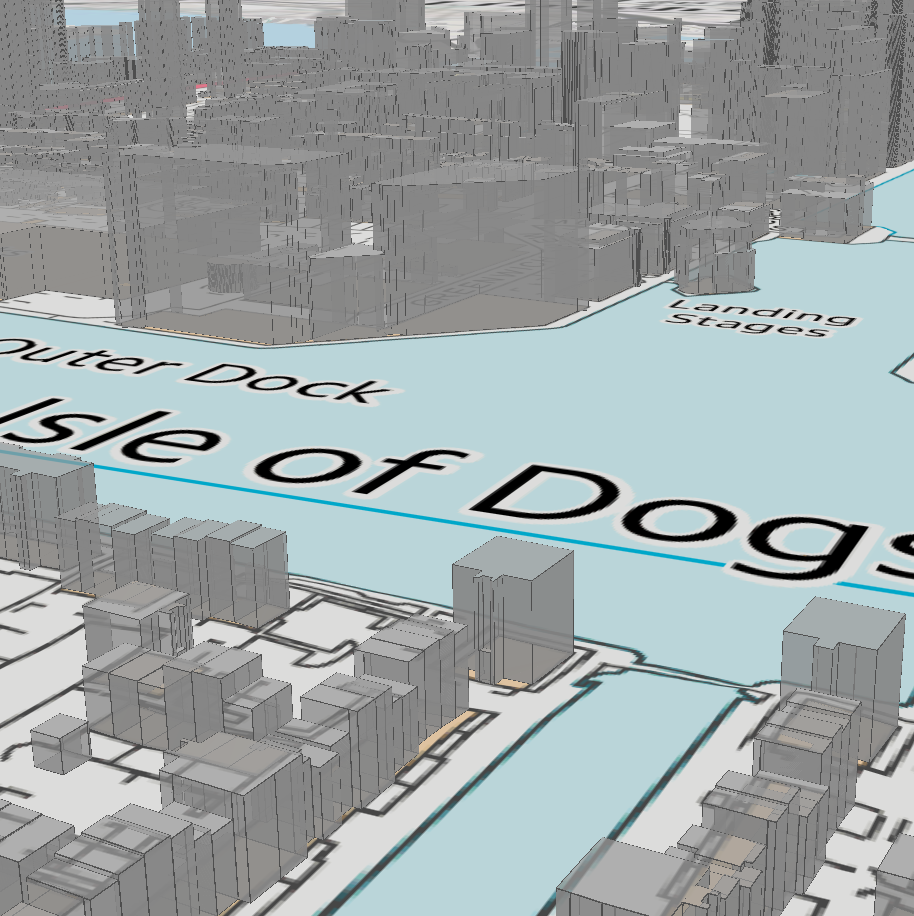
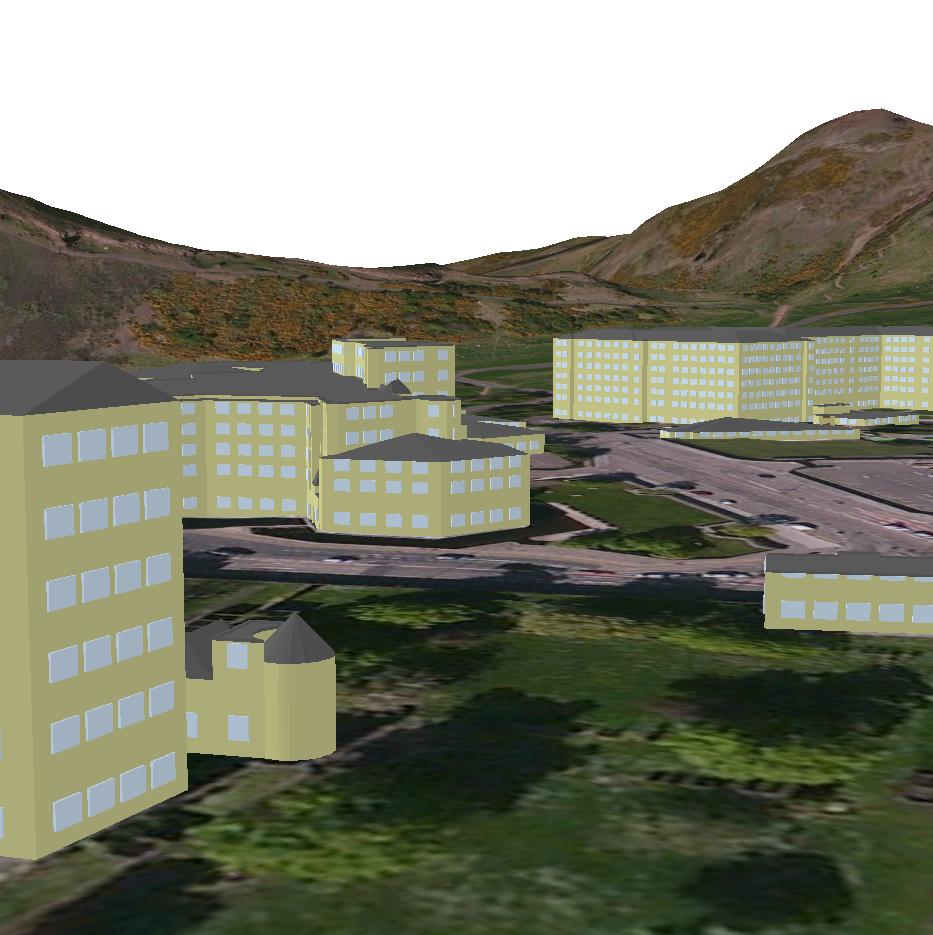
Building a 3D Model
The Next presentation came from Jason Taylor, a technical tutor at Ravensbourne responsible for the production of physical models and prototypes. Jason took everyone through the step by step process of taking terrain data along with building foot prints and heights to create scale models of cityscapes.
[iframe src=”//www.slideshare.net/slideshow/embed_code/49965379?startSlide=1″ width=”427″ height=”356″ frameborder=”0″ marginwidth=”0″ marginheight=”0″ scrolling=”no” style=”border:1px solid #CCC; border-width:1px 1px 0; margin-bottom:5px; max-width: 100%;” allowfullscreen]
Creating Physical Models with Digimap Data – Jason Taylor
The result of his work combined milling of MDF particle board and also 3D Printing of a miniature Millennium Dome. Nearly all of the data used in the production of the model came from Digimap (the details of the Dome’s shape came from a different source), and Jason highlighted the help pages as a great resource for helping him and his students begin to create their models.
The Ordnance Survey Licence
Emma Diffley, EDINA Geoservices Support team leader, then took the audience through the major changes made to the Digimap Licence for Ordnance Survey data.
[iframe src=”//www.slideshare.net/slideshow/embed_code/49965078?startSlide=1″ width=”427″ height=”356″ frameborder=”0″ marginwidth=”0″ marginheight=”0″ scrolling=”no” style=”border:1px solid #CCC; border-width:1px 1px 0; margin-bottom:5px; max-width: 100%;” allowfullscreen]
Digimap Copyright and Terms of use – Emma Difley
This important presentation highlighted the main differences between this agreement and the one it replaced, showing that it is more permissive than before, and that there is now an End User Licence Agreement (EULA) which places emphasis on the individuals to ensure they are abiding by the terms and conditions.
Lunch
During the Lunch break we had presentations from Esri‘s Addy Pope about the ArcGIS Online service; from the CadCorp team who highlighted their free GIS data viewer, MapExpress, and their discounts for educational use; and finally from the British Geological Survey who highlighted their subsurface data and Groundhog website.
Digimap Update
After lunch the delegates were split into two groups with half doing the excursion while the other half was updated on the latest work going on with Digimap and the other Geoservices run by EDINA.
Guy McGarva, EDINA Geoservices Support, gave the Digimap Update presentation highlighting the past year’s achievements and the plans for the coming year. Much of the coming improvements are to do with improving access to the service for mobile devices and also to the data for CAD users. There are also a lot of new products and cartographic improvements to old products going into the Roam online mapping interfaces.
[iframe src=”//www.slideshare.net/slideshow/embed_code/49965258?startSlide=1″ width=”427″ height=”356″ frameborder=”0″ marginwidth=”0″ marginheight=”0″ scrolling=”no” style=”border:1px solid #CCC; border-width:1px 1px 0; margin-bottom:5px; max-width: 100%;” allowfullscreen]
Guy also highlighted some future trends including better integration between services and a shift to delivering more training through interactive webinars rather than face-to-face training.
Fieldtrip GB
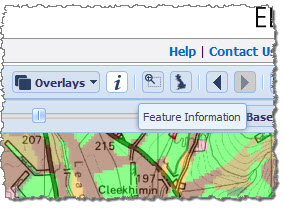
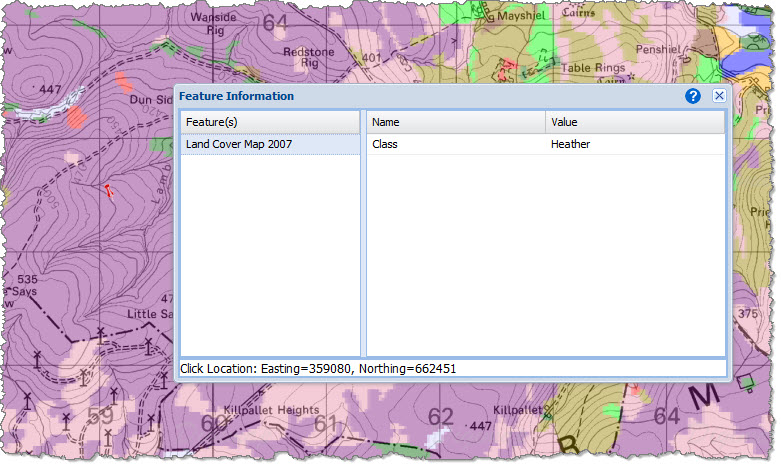
During the Fieldtrip GB excursion Ian Holmes, EDINA Geoservices Support, took the delegates through the process of designing a data collection form, deploying it to the groups mobile phones, collecting data points from around the Greenwich campus and then uploading the data and viewing it on a map. The entire process was carried out live for each group with the minimum of fuss, highlighting the mobile app’s usefulness for carrying out citizen science or group fieldwork.
[iframe src=”//www.slideshare.net/slideshow/embed_code/49965195?startSlide=1″ width=”427″ height=”356″ frameborder=”0″ marginwidth=”0″ marginheight=”0″ scrolling=”no” style=”border:1px solid #CCC; border-width:1px 1px 0; margin-bottom:5px; max-width: 100%;” allowfullscreen]
We also found out about a few of the enhancements coming to the app, including:
- more stable data management
- the ability to longer and more complicated multi-page data entry forms
- an entirely new version with OpenStreetMap data for use worldwide
- the ability to upload your own maps or way-points to highlight where to collect data
Final Summary
 We’d like to thank all the speakers and delegates at this years conference for taking part in a very successful event.
All the presentations throughout the day highlighted the changes in the world of digital mapping occurring right now. We hope that the changes highlighted in the Digimap Update presentation along with the rest of the planned at EDINA will mean the Digimap will continue to be relevant for it users and help them prepare for future work with maps and digital data.
Finally we’d also like to thank the University of Greenwich for providing a first class venue and event coordination team to ensure it was a memorable day.