I decided to use music as my basis for my research on data for my textiles project. but starting with such a broad theme I got a bit overwhelmed with how much data there was, I couldn’t decide which aspect of data I wanted to transfer into textiles. I thought about using visual graphs of the music I listen to and how often, and using that visual representation in my textiles. I have a Spotify premium account and every year they send me the the data of what I’ve listened to the most and how many hours I’ve spent listening. I also thought that I could making visuals of the music by drawing whilst listening to it, this would be a more direct and original way to translate into textiles. And it would be very interesting to use different genres of music to see how the drawings/information would change.
My flatmates play a lot of music and often have Jams, which I think would be very interesting to incorporate, because live music captures your senses in a way that recordings doesn’t.
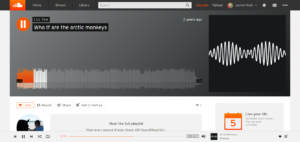
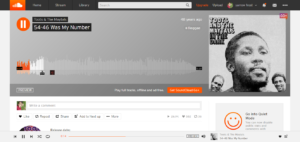
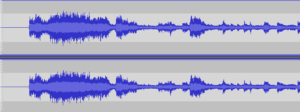
I started to think about the visualisation of sound, and remembered my friend showing me a song on Soundcloud, which actually shows the sound waves of the song you are listening to! I looked up the website and searched for some songs that I listen to a lot, see the two pictures below. However unless you buy a subscription to Soundcloud you can only access a small snippet of the songs.
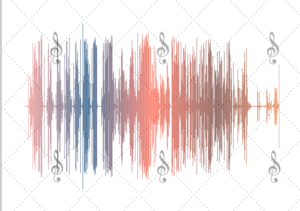
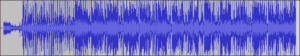
So I did some more research and found several apps which allow you to upload songs and they will show you a visualisation of the sound waves! Unfortunately to properly create the image you had to pay for it, however you could do a sample (see image below) this still showed the sound waves, but it has watermarks all over the image which is kind of distracting. I do like the colour gradient that it makes, however I do not think it actually applies to the actual music and is just fro aesthetics.
This was a very exciting discovery, but I felt that the apps were a little bit limiting. So I spoke to a friend who is studying sound technology and they recommended a sound editing app called Audacity, which allows you more control.
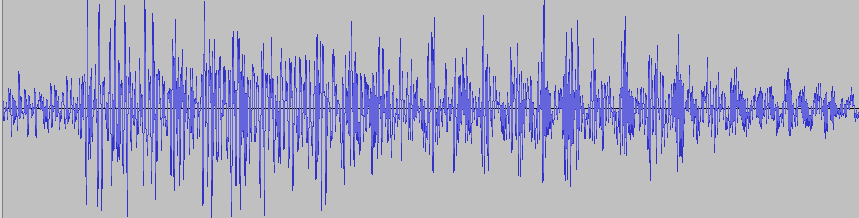
With audacity I discovered that you can crop parts of the song so you can see a more detailed visualisation of the sound wave, I did this five times, gradually showing smaller and smaller parts of the song.
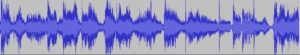
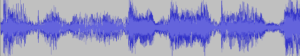
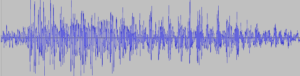
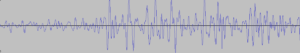
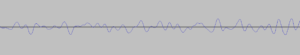
I particularly like the last image, where there is more space aroung the line so you can really see the definition of the curves!
At first I was thinking that I wanted to specifically use music for my data, but after finding this I actually think it would be interesting to use sound in general. perhaps record different day to day sounds around me (such as the kettle boiling, taps running etc) and turn them into visuals. for the moment I am going to experiment in samples with these visuals of music, but I will also start to record sounds to make into textiles as well.
Bibliography
https://qz.com/921662/software-engineers-have-figured-out-a-way-to-turn-charts-into-music-for-the-blind/
https://www.classicfm.com/discover-music/latest/graphic-scores-art-music-pictures/cage-water-music/
https://www.serendipidata.com/posts/visualizing-musical-data


lrichar3
14th October 2020 — 6:44 pm
This is such an interesting approach to the project. Your idea in this last paragraph to record daily sounds is absolutely intriguing. The link to the artist David Hall is PERFECT for this project..what in inspiring person. Brilliant potential here.