

It’s finally here – our third instalment of our new and exciting series Tell Us About Your Methodology! We have had more conversations with our PGR cohort to find out what people are working on, and this month Sian Bedford, 2nd year PhD candidate (Health in Social Science), tells us more about using State Space Grids within a dynamic systems approach
What methodology are you using?
I am taking a dynamic systems perspective to explore parent-adolescent interactions. Dynamic systems methods are a family of principles and techniques used to study how a collection of elements move together or change over time. For example, if you think of the popular desk toy a Newton’s Cradle, the movement of one ball affects the movement of another. Dynamic systems methods could be used to describe the behaviour of the system as a whole and how the movement of one ball affects the others. If we think of each person during an interaction as an element in a system, then dynamic systems methods can be used to analyse human behaviour. My favourite dynamic system method and the one I will be using in my PhD is the use of State Space Grids which can visually depict an interaction by understanding how each person in the system moves through different states, both individually and in conjunction with the other.
What are the key aspects of this methodology?
Step 1 is to code an interaction.
- I’m looking at parent-adolescent interactions where the pair were asked to work together to try to solve a logic problem.
- Each individual’s behaviour is coded separately for positive, neutral, and negative emotional affect using a coding scheme that has been adapted for this task. The codes will then be plotted against each other in combination on the grid
- In the example given the interaction was divided into 5 second intervals, and for each interval a code is selected that represents that person’s behaviour for those 5 seconds.
Step 2 is to create a State Space Grid.
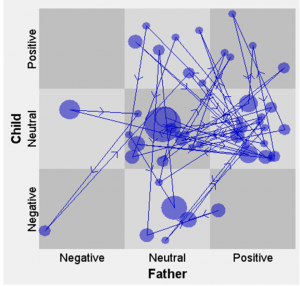
- As you can see from the example given (fig.1), there are 9 cells in total, one for each possible emotion combination.
- The behaviour of the parent is plotted on the x-axis and the child’s behaviour is plotted on the y-axis.
- Every time someone changes emotional affect a new point is plotted in the cell representing the new affect combination. A larger point reflects a longer amount of time spent in that emotion combination before transitioning to a different emotion.
- Lines and arrows connect the points allowing the interaction to be followed through time.
- State Space Grids can be created in programming packages such as R, or there is a dedicated software called GridWare.
Fig.1 – A State Space Grid showing parent and child’s behaviours plotted in combination
Step 3 is to analyse the State Space Grids.
- The State Space Grids can be visually compared between parent-adolescent pairs to look for any differences in patterns of behaviour.
- Certain characteristics of the grid can be used to measure flexibility in different ways. For all measures higher values represent higher flexibility.
- The range is the number of different affect combinations used during the interaction, so the number of cells with at least 1 point in it. The range in the example is 8, there is only one cell (where the father is in negative, and the child is in positive) that has not been used.
- The number of transitions is the number of times the parent or child changed affect combination, or the number of arrows on the grid. The number of transitions in the example is 47 out of a maximum of 120, this parent-adolescent pair moved between cells 39.17% of the time.
- Dispersion is a measure of how spread out the points are. This is a number between 0 and 1, where 0 represents no dispersion and all the points are in one cell, and where 1 represents maximum dispersion where the points are evenly distributed between the cells. The dispersion in the example is 0.862.
- These flexibility measures can then be used as data and analysed using traditional statistic techniques. For example, you can compare the flexibility measures between different sets of parent-adolescent pairs, perhaps based on age or gender. It is also possible to look at correlations between the flexibility measures and self-report data.
- Another interesting piece of data is to calculate the time spent where both parent and adolescent are experiencing the same emotion at the same time. Which can then be compared between parent-adolescent pairs to consider coregulation of emotions. In the example, the parent-adolescent pair were emotionally congruent for 42.98% of the interaction. They were both in neutral for 36.35%, positive for 4.96%, and negative for 1.65% of the interaction.
Why did you choose this methodology?
I was first introduced to this application of dynamic systems methods by my dissertation supervisor whilst studying towards a MSc. I was drawn to the methodology as it required a combination of skills I had not learned before, I was able to try coding interactions, using a new computer package, and learning how to analyse the data. This methodology allowed me to combine my fairly mathematical way of thinking with my passion for psychology. Once I had submitted my MSc dissertation, I realised I had really enjoyed the experience, and decided to do a PhD using the same methodology.
Why would you recommend this methodology?
There is a whole world of dynamic systems methods out there that can be used if we think outside the traditional linear box. The methods are versatile, with State Space Grids you can vary the relationship between the people you are looking at. For example, some studies have plotted a teacher’s behaviour against the class’s behaviour, so you aren’t even restricted to individuals. Alternatively, some research has used state space grids to compare interactions from the same parent-adolescent pairs but varying the type of task. Whilst other research has compared interactions from the same task with the same participants but at different life points.
What additional training / help was needed to use your methodology?
I haven’t actually received any formal training in these methods. I started out by reading the articles that had used these methods, taking particular care over the methodology sections to try to wrap my head around them. For my MSc dissertation I used the computer program GridWare to create the State Space Grids. Luckily this is free to download, and as there are few formal training routes, it also comes with an extensive manual which takes you through how to use the program step by step, and there was some testing data which allowed me to experiment with the program.
What are the benefits of this method?
Developmental psychology often acknowledges in theory that development does not occur in a straight line and emphasises the importance of context. However, surprisingly few studies use a non-linear approach when exploring development. Dynamic systems methods allow for the exploration of fine-grained data to explore how change occurs rather than just noticing there has been a change. In the case of my PhD, I’m looking at the granular details of an interaction to plot the behaviour as it occurs rather than focusing on the outcome of the task.
The benefits of State Space Grids in particular is that they are a more user-friendly method. Most dynamic systems methods involve a lot of algebra with differential equations and simulation models, and lots of people do not have the time or resources to invest in these methods. State Space Grids are a more intuitive way to look at an interaction as it occurs, which makes them more accessible for psychologists to use and easier to explain when writing up research.
What are the challenges of using this methodology?
The main challenge is just how time intensive the process is. Coding interactions in such small intervals really helps when looking at an interaction in fine-grained detail, but it does take a long time to do. It is something I underestimated at the start of my PhD as I only coded three interactions for my MSc dissertation. A second challenge is the methodology does require an investment in time and effort before they can be understood and applied. Dynamic systems methods are not found in the typical statistics books and are not regularly taught out of the science and maths departments.
Where can I find more information about this (e.g., key publications)?
- For more information on State Space Grids, I would recommend the following article: Hollenstein, T. (2007). State space grids: Analyzing dynamics across development. International Journal of Behavioral Development, 31(4), 384–396. https://doi.org/10.1177/0165025407077765
- For an example of research using a clinical population (in this case comparing parent-child interactions with and without the child having an anxiety disorder): Van der Giessen, D., & Bögels, S. M. (2018). Father-Child and Mother-Child Interactions with Children with Anxiety Disorders: Emotional Expressivity and Flexibility of Dyads. Journal of Abnormal Child Psychology, 46(2), 331–342. https://doi.org/10.1007/s10802-017-0271-z
- Information on the computer software GridWare is available at: https://www.queensu.ca/psychology/adolescent-dynamics-lab/state-space-grids
What errors / limitations did you wish you would have spotted earlier?
Something to bear in mind with this methodology is it is often about looking at a small moment in time very deeply, looking at an interaction at the granular level to really piece together how the process of an interaction occurs. After watching an interaction and coding in five second intervals, I now understand how much can change in a short space of time during an interaction. I had been coding at 10, 20, or even 30 second intervals, whilst less time intensive, some of that fine-grained data would have been missed. However, the amount of time it takes to do shorter intervals means you realistically have to limit the number of participants. Using this methodology often means there is a trade-off to be made and the data from fewer participants is explored in detail rather than gaining small amounts of information from a larger sample.
What advice can you give to other people using this methodology?
My main piece of advice would be… if this methodology is of interest to you, have a look into it and give it a go! I think at first look people may be put off thinking they would need years of advanced training, but some of the methods, like State Space Grids, are much more accessible.