
Hot off the press: Data-driven optimisation of seismicity models using diverse datasets
Forward: One of the big challenges with forecasting natural hazards is how to combine the disparate range of data-types that could inform a forecast. With seismicity, this includes the point location of past events, line maps of the location of known active faults, and raster maps of the rate at which the crust is straining measured by satellites. Combining all of these together in a sensible way is challenging – and that is before you have even started testing whether the forecast is useful. In this paper, we adapt a framework from ecological statistics that leverages existing packages in R to handle a range of spatial covariates and use inlabru to generate and test a range of seismicity forecasts for California.
BLOG AUTHOR: Dr Kirsty Bayliss (PDRA, H2020 RISE)
REFERENCE: Bayliss, Naylor, Illian and Main (Available online) Data-driven optimisation of seismicity models using diverse datasets: generation, evaluation and ranking using inlabru, Journal of Geophysical Research: Solid Earth
The Challenge
There are many different types of spatial data that might help us to explain the observed patterns in earthquake locations. We want to be able to construct models that use these data types to describe observed seismicity in order to improve earthquake forecasting, but to do so we need to understand how these data types can be best combined to make a good spatial model that describes what we observe. We can start with a fault map, but we know this will be uncertain and incomplete, so what can we add to help? Can we improve a model by adding in slip-rate information, and is the slip-rate on individual mapped faults more or less useful than large-scale satellite-derived observations of the strain rate, for example? How can we be sure which components of our model are most useful?
Essentially inlabru lets us explore these questions, by combining different spatial datasets to try to explain observed earthquake locations and to rank the resulting models. We generated many different models for California seismicity using combinations of existing spatial datasets and evaluated the results to help build data-driven spatial models of earthquakes. Our approach allows us to take advantage of many different data types and to assess how well each of these performs individually and as part of a more complex model. These inlabru models will form the basis for full earthquake forecasts that make use of the best possible spatial information.
Building spatial seismicity models
In statistical seismology, a common way to model earthquakes is as a point process, which is a mathematical description of how a collection of points are distributed in time, space or both. While statistical seismologists have quite reliable and well-used methods for describing the earthquake distribution in time, explaining the locations of earthquakes in space is trickier. We use inlabru to construct a spatial point process model where we consider that the observed earthquakes are distributed with an intensity that is a combination of some underlying spatial factors (which we’ll call “covariates”) and a random component that accounts for everything the spatial components do not. We are essentially describing observed earthquake locations as partly deterministic (i.e. determined by some known spatial covariates) and partly stochastic (i.e. a bit random). Inlabru is a computational toolkit that allows us to construct and evaluate these spatial models in a Bayesian way.
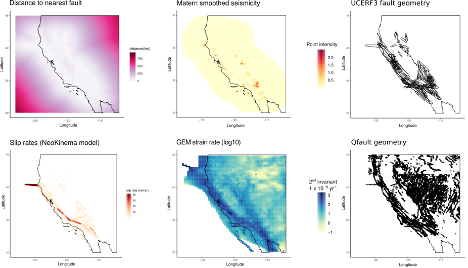
The figure above shows the different spatial covariates that are included in our models. These datasets are mostly from the UCERF3 model which is used to forecast earthquakes in California, but also include a global strain rate model and a distance-from-fault map that we generated from UCERF3 faults to account for off-fault seismicity. We constructed many models with different combinations of the spatial covariates shown here and a random field. Adding or removing components changes the spatial structure that the random field accounts for. If we could describe all of the observed seismicity with the covariates, the random field component would be zero. We use the DIC (a statistical estimator that considers how well a model fits the data) to compare the performance of the different models as a description of the observed seismicity. This way we can identify the combination of components that best describes the locations of earthquakes.
Identifying useful components
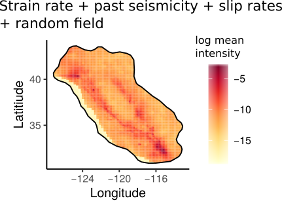 The figure to the right shows an example of a spatial model, in this case the best performing model for M4+ seismicity in California. The higher the (log mean) intensity, the more earthquakes we would expect to occur in that spatial area, with highest intensity areas coloured red. If we compare the intensity map with the input covariates above, it is clear that the strain rate is lending a lot of detail to this map, but the faults are also reflected because of the inclusion of the slip rates and the past seismicity is also contributing to the total observed intensity so that this model has a lower (better) DIC than models without the past seismicity.
By considering multiple possible models with different combinations of components, we consider which components perform well on their own and in combination with other components by ranking the models according to their DIC. The past seismicity performs well, which is consistent with previous findings. The strain rate does a good job because it accounts for some areas of increased seismicity that the past seismicity doesn’t account for. The fault distance map performs poorly on its own but does a good job when combined with other components because it helps explain some of the seismicity that occurs close to, but not exactly within, the fault geometry used in the models. The fault geometry on its own did not perform all that well due to the large amount of off-fault seismicity, but it was useful when combined with other components that could account for that. Inlabru lets us easily swap components in and out to see which components are most useful and to rank models quickly to determine the best models given the available data.
The future of earthquake models with inlabru
While spatial models are useful for understanding where earthquakes have been, what we really want to know is where they will be in the future. We are currently building our spatial inlabru models into full earthquake forecasts which will then be tested alongside other forecasts in real-time. We will be applying this approach to develop earthquake forecasts for Southern Europe as part of the RISE project. Here we have taken the first step by demonstrating just how valuable the inlabru approach might be to future earthquake forecasts in terms of its flexibility and ability to describe spatial patterns.


Recent comments