Data and networks, abstract information in tangible textile formats
Project 1, exploring basic analogue textile construction
stitch, crochet, knitting, weaving and knotting
Exploration with materials and technique is the basis for this project., however, in order to keep the sampling fresh and unique, students have been tasked with gathering information to fuel and underpin practical investigation.
We are living in a period of intense analysis of data and statistics. Social media data, the covid track and trace systems, political polls, our online shopping preferences, are all tracked for statistical analysis. Networks and connections are identified and scrutinised whether on a global or personal scale. The results of the interrogation identify links , connections and clusters. Interpretive codes are a useful way to present this type of information, demonstrating useful pattern within the statistics which are used to support and direct decision making for practical and economic as well as health choices, however it can be how these are communicated that either grasp our interest or have us turning off at the first sight of another bar chart.
Artists and designers using data as a means of communication
Using data as a means to drive art and design is not new. However the abundance of data available to us in this digital age can feel overwhelming and difficult to navigate. Artist Laurie Frick https://www.lauriefrick.com describes….Data is like plastic, incredibly useful and horrible at the same time.
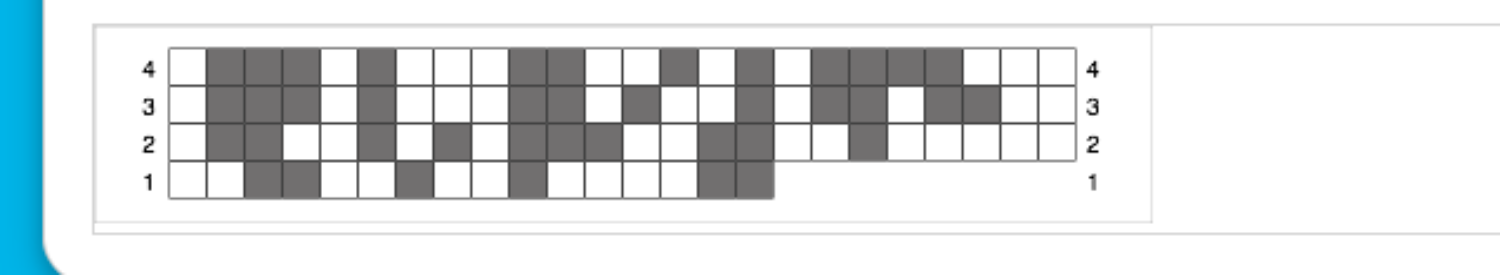
Laurie Frick, 7 stages of ALS, 2010
Frick deliberately uses tactile materials to communicate with her audience. My work attempts to explain and anticipate a world of pervasive data through large hand-made patterned wall installations. To contrast a cold and polished computer aesthetic, I use warmer, more familiar materials like wood, paper, wool, leather and glass. I believe the physicality of data and hand-built patterns will let us read and understand what our bodies and behavior tell us. Numeric data are abstract concepts, as humans we simply can’t make sense of large numbers, but we do have an ability to understand pattern – especially colorful pattern intuitively. https://www.lauriefrick.com, accessed 29.09.20
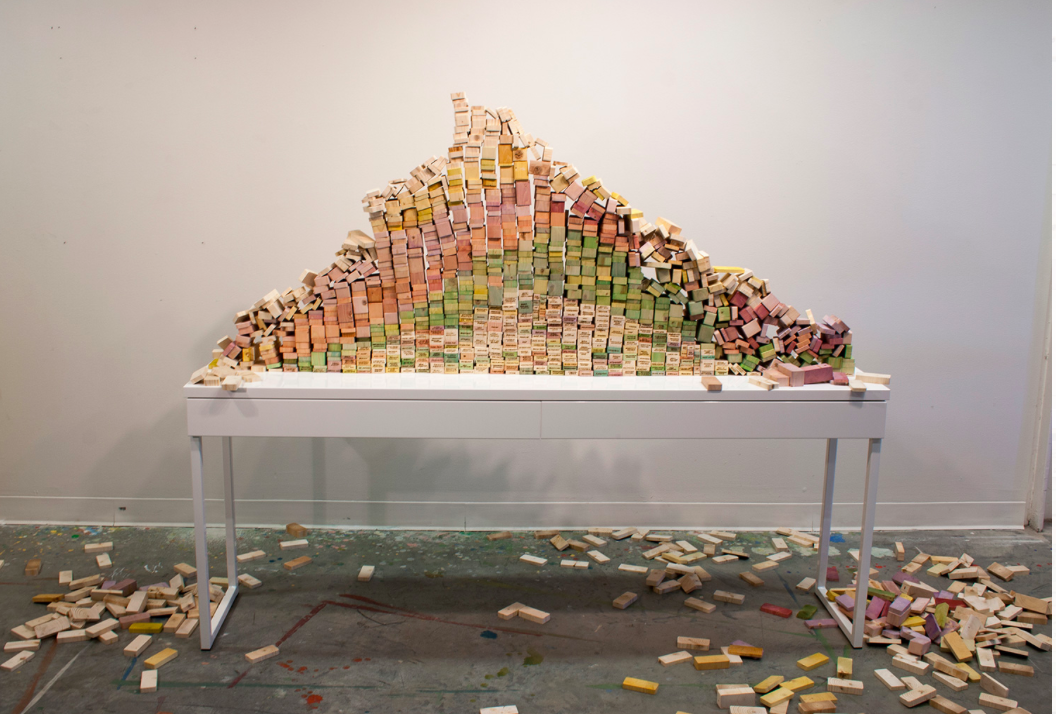
Textile artist Richard McVetis https://www.richardmcvetis.co.uk tracks time and intervals of time using stitch as his marking tool as a series of tiny lines., dots, dashes and crosses.
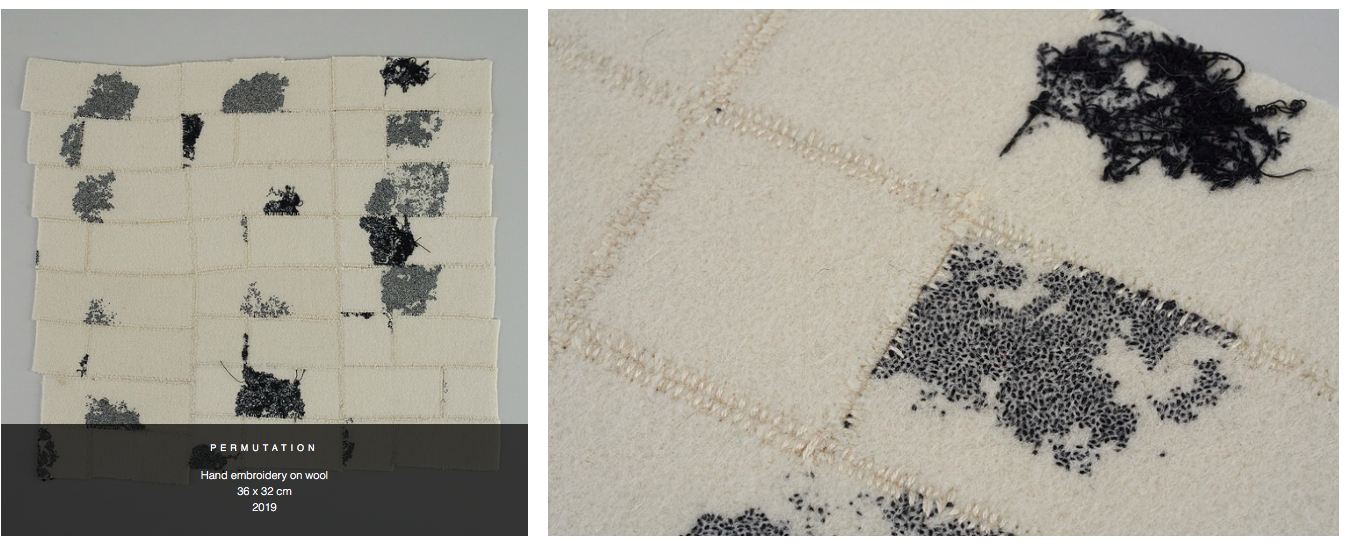
Permutations 2019
What appears to be a never ending thirst for data and statistics, with endless analysis can sometimes feel difficult to navigate. The endless government graphs, percentages and pie charts of covid cases, lockdowns and global analysis of the pandemic can feel impossible to connect with.
Artist Nathalie Meibach very eloquently presents her methods in taking raw data and transforming it not only into engaging sculpture but into musical scores.https://www.ted.com/talks/nathalie_miebach_art_made_of_storms?referrer=playlist-art_from_data
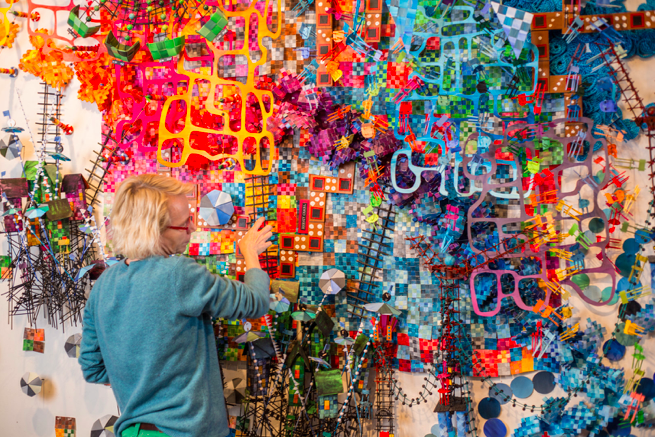
Nathalie Meibach weaves the weather,
photographer Izzy Beidan
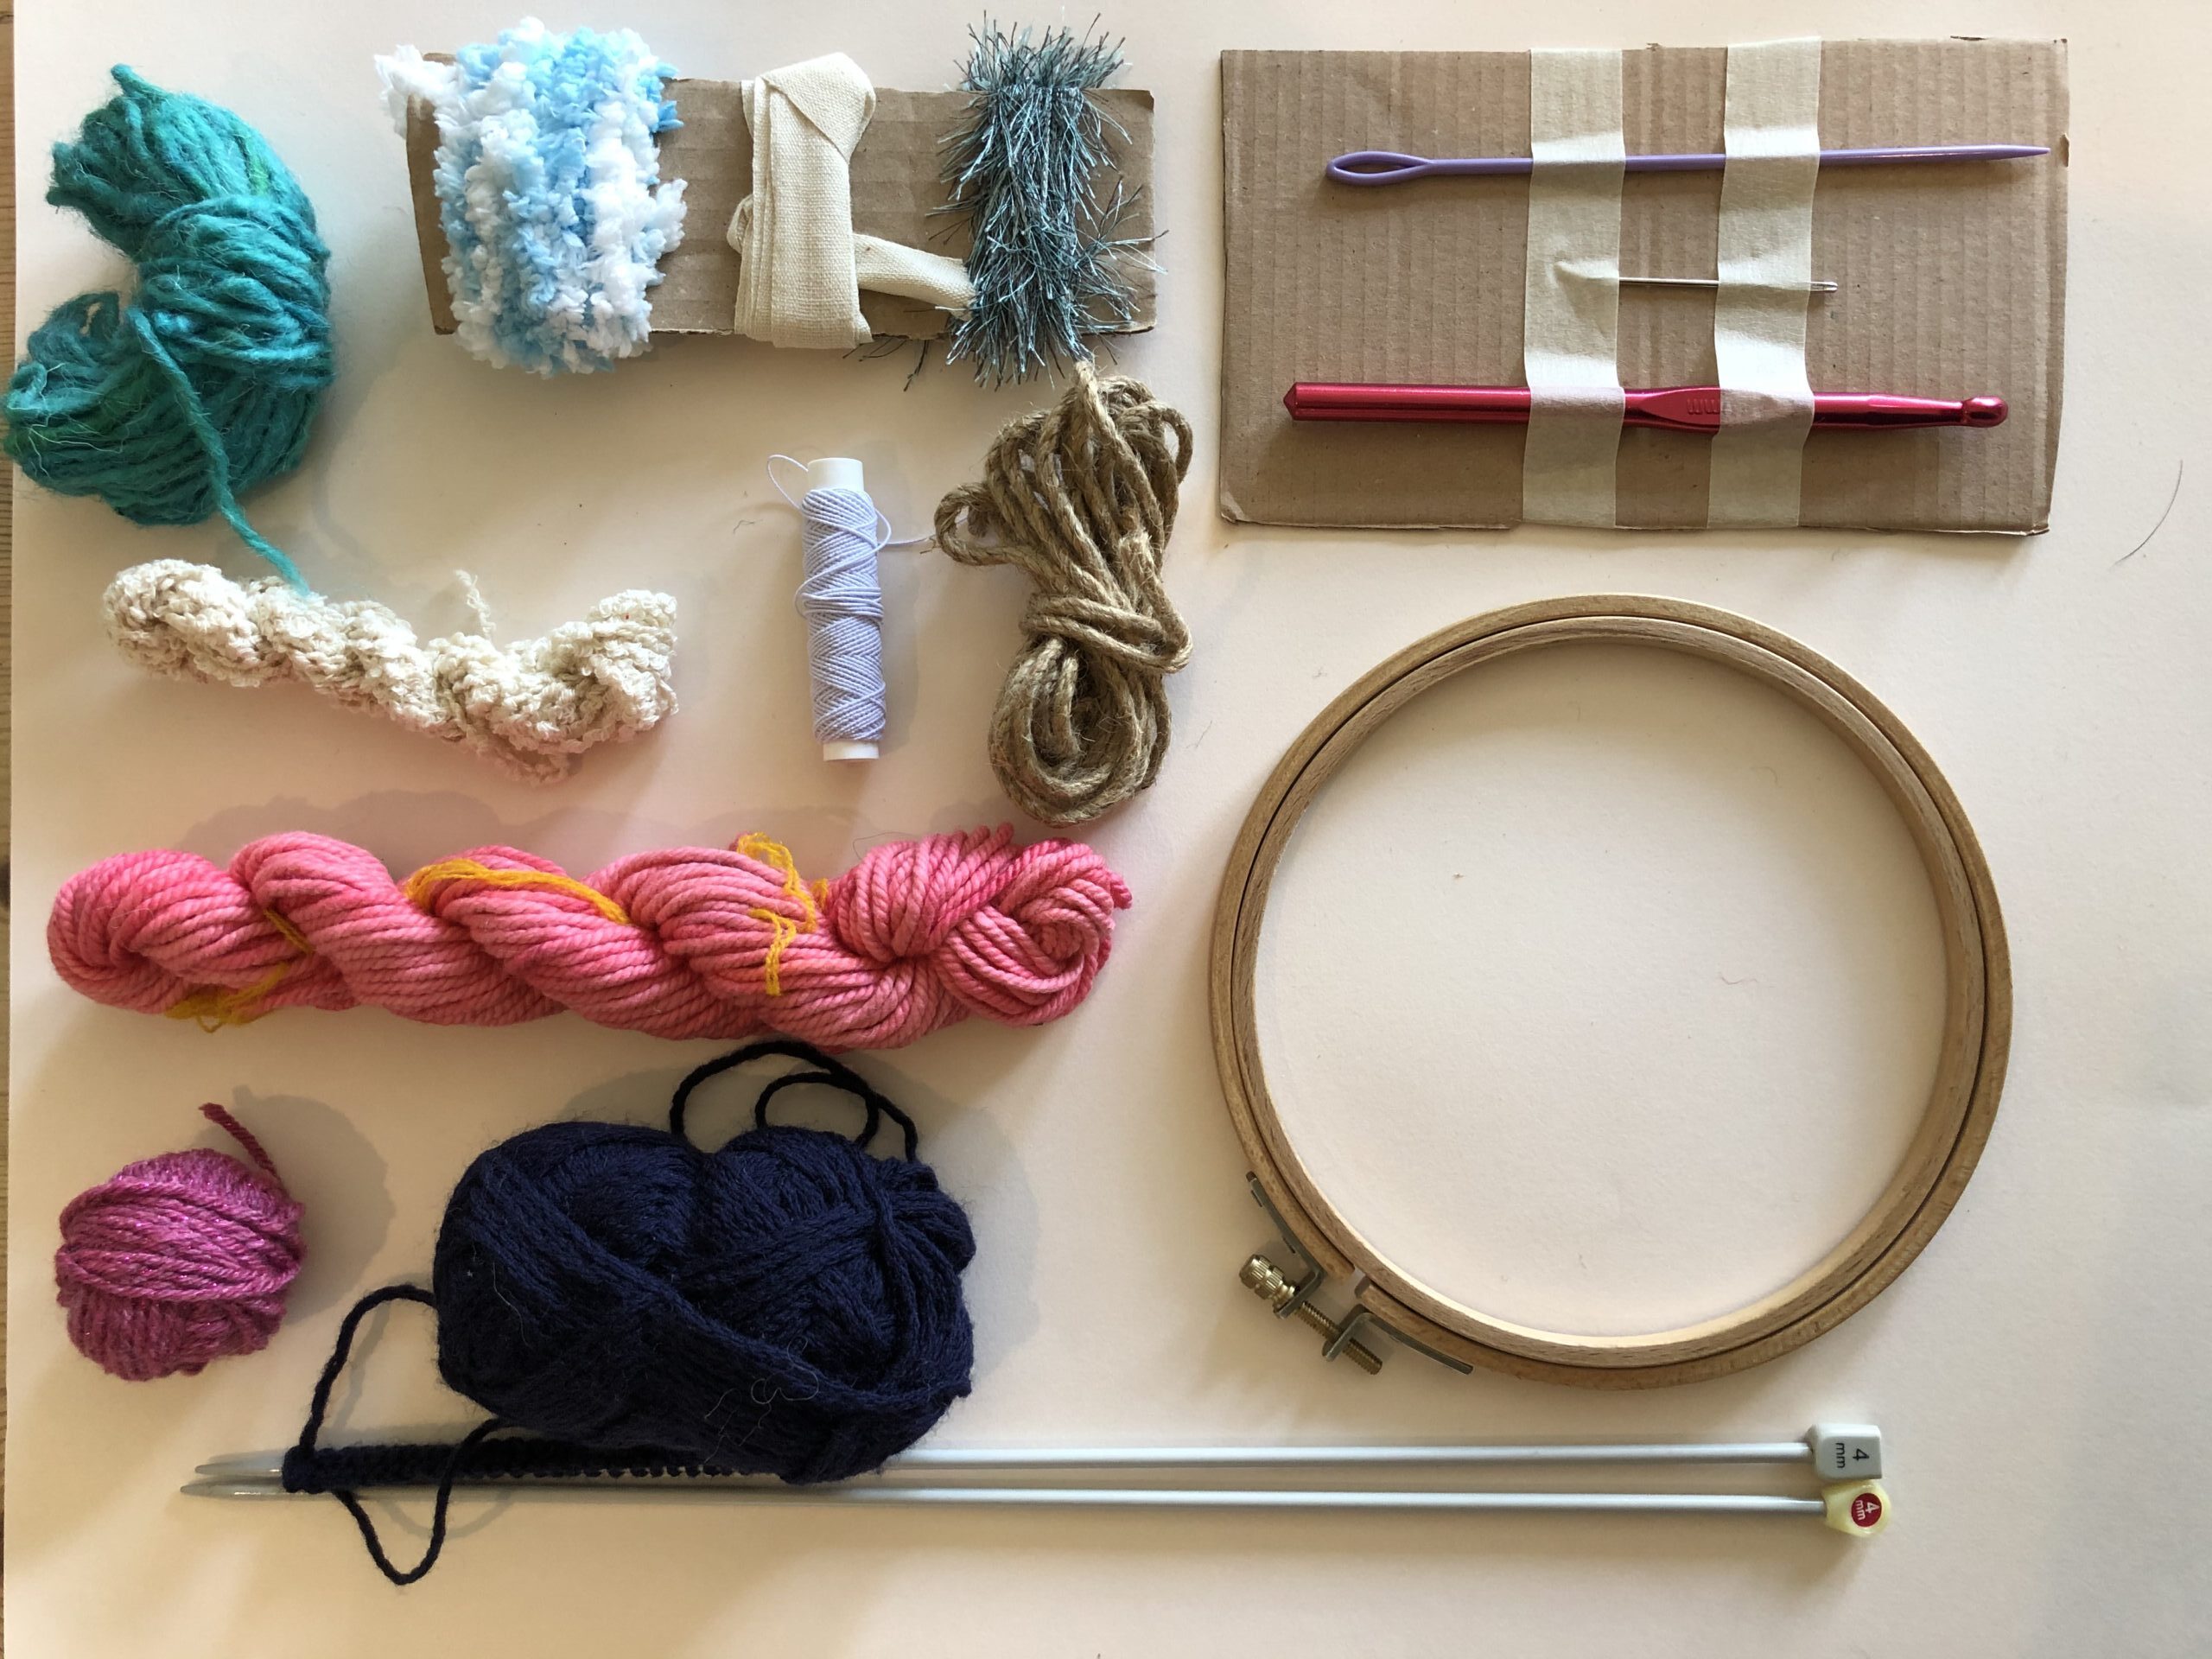
2C starter toolkit, Lindy Richardson
ECA 2nd year textile design student cohort for 2020. Armed with their own data research and identification of networks, the undergraduate students enrolled on this course will be using this starter kit to develop their projects. Posted out to them in their flats and homes, this little analogue kit will hopefully launch the creative connection from data to textile experimentation that will be logged in future posts.
(Laurie Frick,2010)
(Permutations 2019)
(Lindy Richardson, 2020)
(Izzy Beidan)


Recent comments