
Continuing work on ARIMA forecast
Happy new year! I completed some more work on the ARIMA dataset before Christmas that I wanted to share.
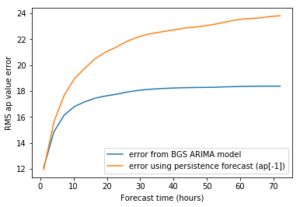
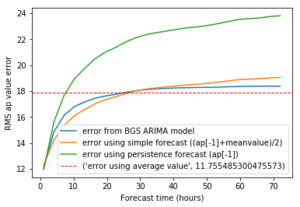
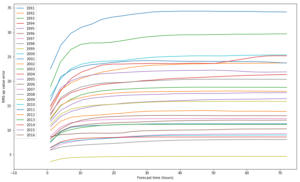
I firstly applied the same method as I used in previous analyses, plotting the RMS error over the full forecast time to see how the different methods react to longer forecast times. Using the full 1991-2016 dataset, you can see that the error from simply predicting the average value is now an improvement on the BGS ARIMA model at the longest forecast scales (longer than ~1 day). You can also see that the simple model I created based on the persistence model and the mean in equal proportions is also an improvement at lower time scales. I would see this as evidence that the ARIMA forecast does not appear to react well to high geomagnetic indices (presumably because they are so rare).
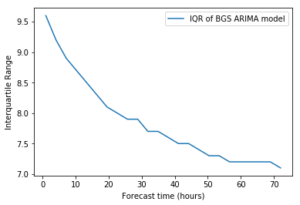
As expected, the Interquartile range (IQR) of the forecast decreases over time, suggesting that longer forecast times will have a smaller range of values which are regularly predicted, though this effect is not as significant as I was expecting, and there still seems to be some variation in the results given at ~72hour forecast times.
When plotting the error yearly, you see that the forecast has a huge difference between the most error-prone and least error-prone years. 1991 and 2003 have the highest error.
I also plotted this information onto a colour plot to visualise more easily.
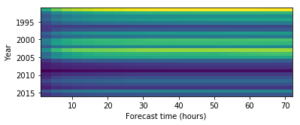
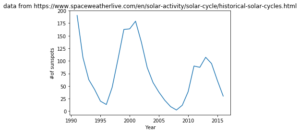
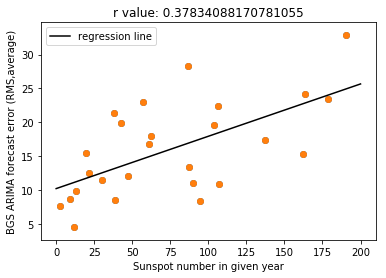
Using this, you can see that there appears to be some correlation between solar maximum and high error in the forecast. Using an approximate graph for sunspot numbers (to give some form of context), you can see that there appears to be some form of correlation.
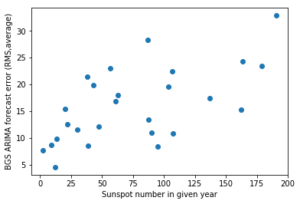
I used linear regression on this data to produce a regression line and provide a regression coefficient.
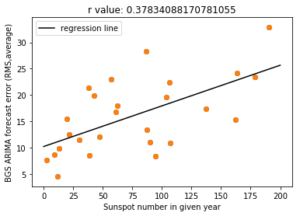
Using this, you can see that sunspot number does have a significant effect on the BGS ARIMA forecast. I would, however, claim that there are likely to be other factors at play here, as the correlation coefficient is not very high (only ~0.4). This may be due to other factors in the data; as an example, a possible reason why 2003 was so error-prone despite the relatively lower sunspot number may be related to the Halloween 2003 storm, which may have introduced high error values which distort the trend. (Sunspot number is average in 2003 but the error is relatively high!)


Recent comments