In the last few months, I have begun an obsession with Guyanese Politics which I feel I have to share here. I have some opinions on what I have found which I think are valuable as a third party with no particular interest in Guyana. I would like to say that my opinion of guyanese […]
Effect negligible. Further research determined only a small subset would likely have an influence (GLEs), not enough GLE events to do a good analysis. (only GLE event with DSCOVR EPIC data was in 2017, and the days around the event do not have any images). Analysis was completed to some degree! graphs were calculated […]
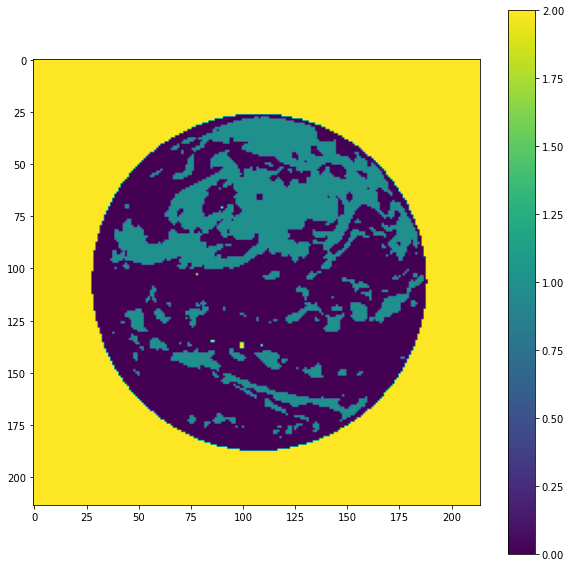
Hi, I am currently working on the concept of using the EPIC camera to try to look at SPEs and their immediate effect on cloud cover. At current, it appears that the camera does not have sufficient data so I may have to find a geostationary station instead. The effect of the Forbush Decrease […]
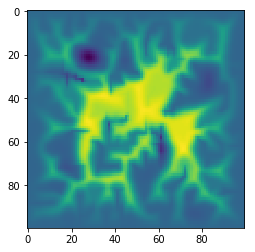
In my spare time, I completed a pretty cool erosion function which I would like to keep. It looks like this: It features a wind/elements based approach which acts to smooth the surface, alongside a rivers-based approach which creates the channels. together they create very realistic models of different features! This is […]
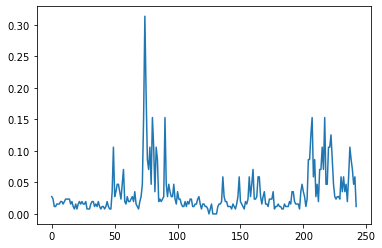
Just some stuff I did with Ap data from 1991 to 2016. First of all, it is clear that ap data is not continuous, and appears in seperate bins (as expected). Highest values around 400. x axis is time (in hours since 1 1 1991). The Ap index increases as frequency decreases (sorted version of […]
MTF results- this problem 1D CNN: Input example: Outputs: Training Loss figure: Clearly better than the MTF method in my opinion- more decisive and more accurate.
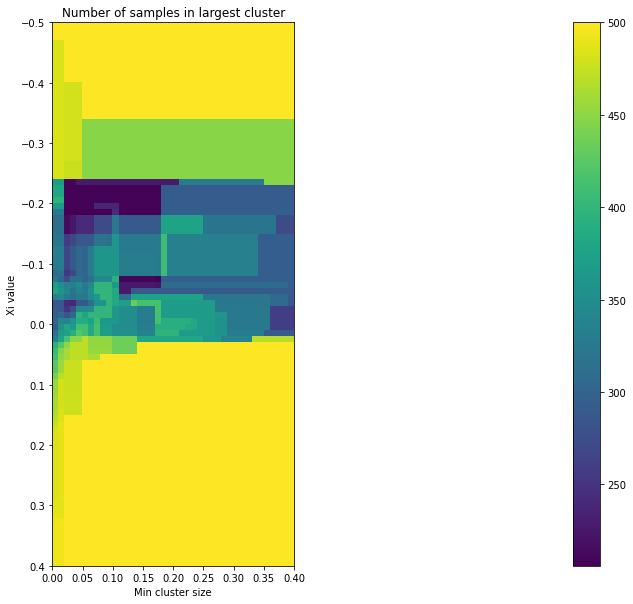
Just a summary of some cool things I have done in Leeds so far. I helped somebody with a parameter problem by creating a map of the results of a machine learning clustering algorithm in parameter space- that was fun. I found that negative Chi values worked well for the OPTICS algorithm (though I am […]
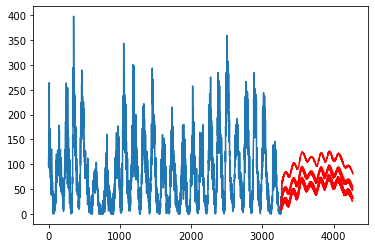
I just finished applying an LSTM to Space weather data (Sunspot number over the last few hundred years.) It is a work in progress, but I am happy that I have at least managed to start to do what I was intending to. The x-axis is in terms of months (like I said, it is […]
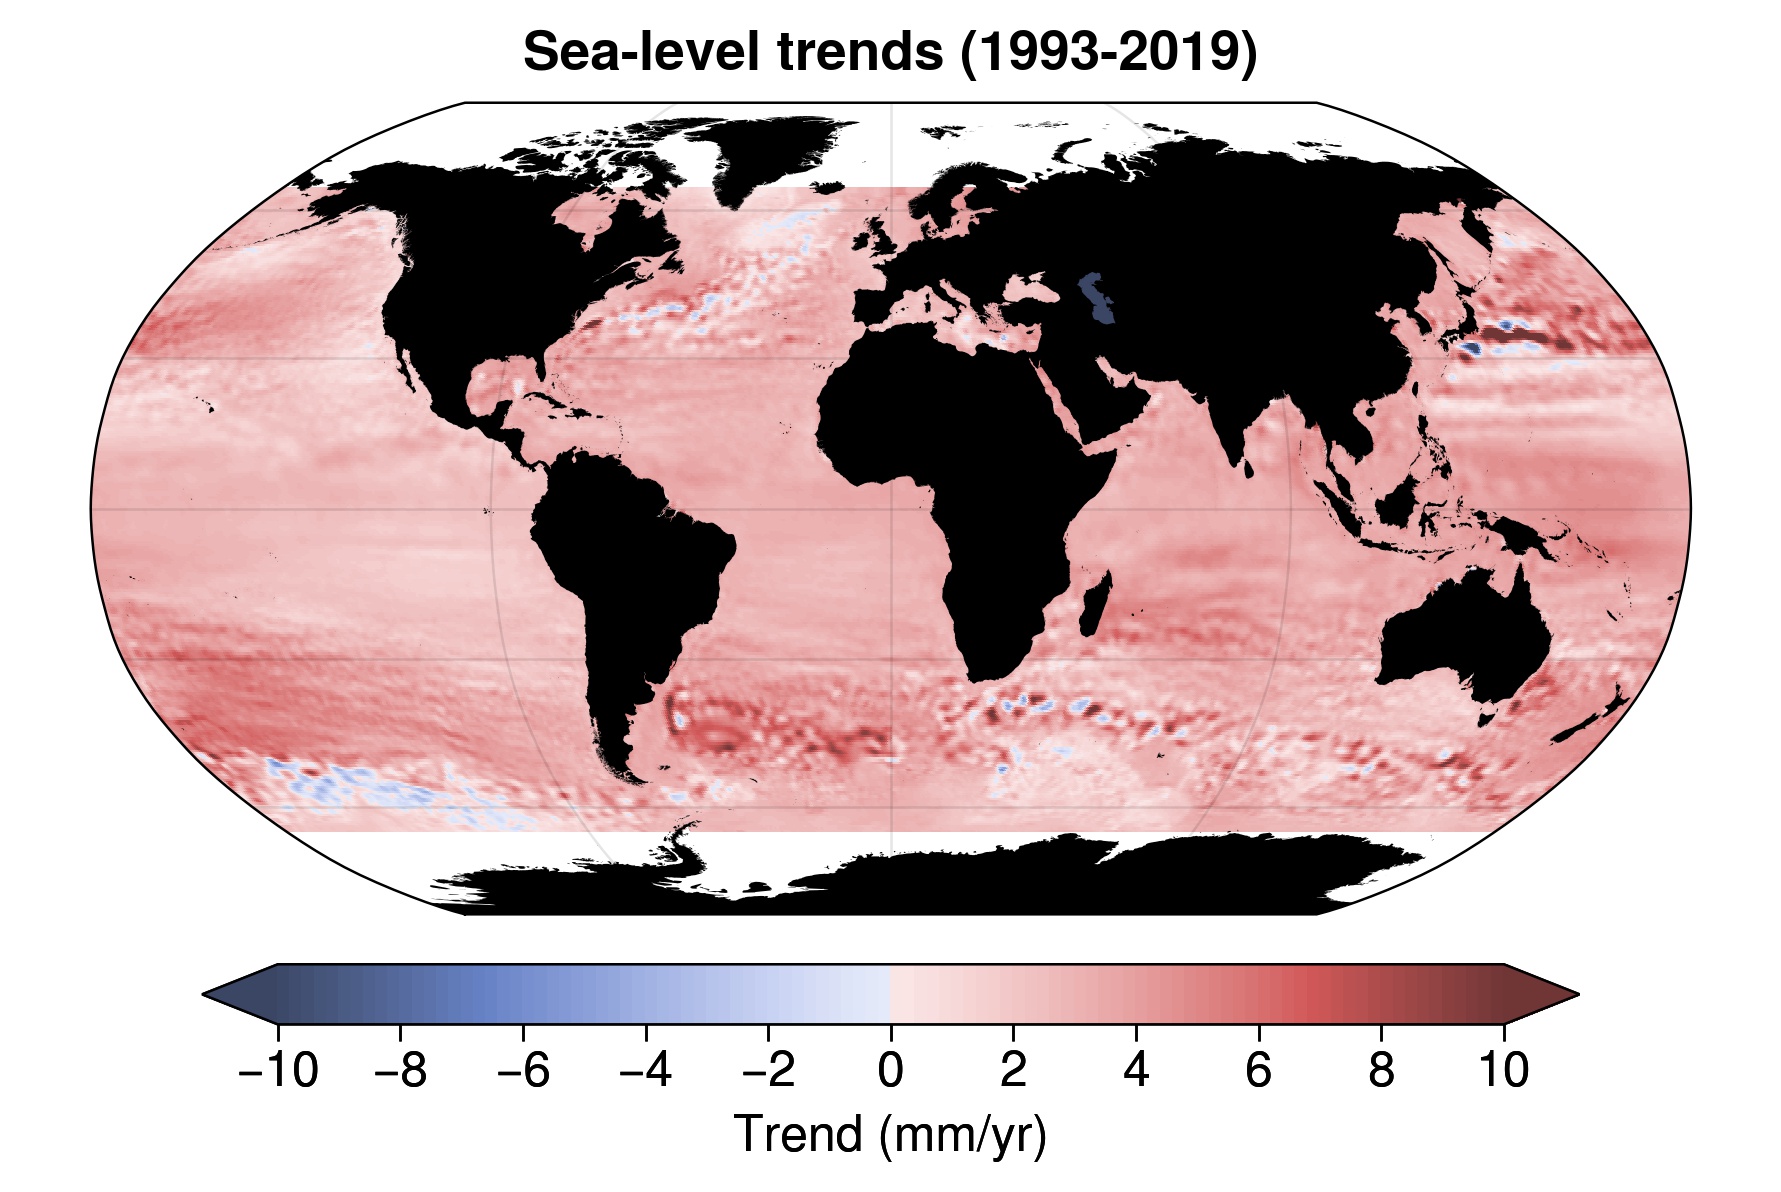
This week, I have been doing some oceanography training. I will present the map below and expect it to be self-explanatory in terms of the overall tone. It is clear that accurate measurements show that average sea level rises by one centimetre a year, which is slightly concerning. At one station (Newlyn, UK), the following […]



Recent comments