
We released a new version of Digimap last week (2nd February) which included a number of improvements to the service. Whilst we try to minimise downtime during releases some users may have noticed some of the new features; in this post we’ll highlight the changes that affect Digimap users.
Chart Roam
By far the biggest change happened in the Marine Collection where the old, somewhat dated, Marine Maps application was replaced with the new Chart Roam application. Chart Roam uses the familiar Roam interface to display hydrographic charts, enabling users to quickly and easily navigate around using the tools they are familiar with from other Roam clients.
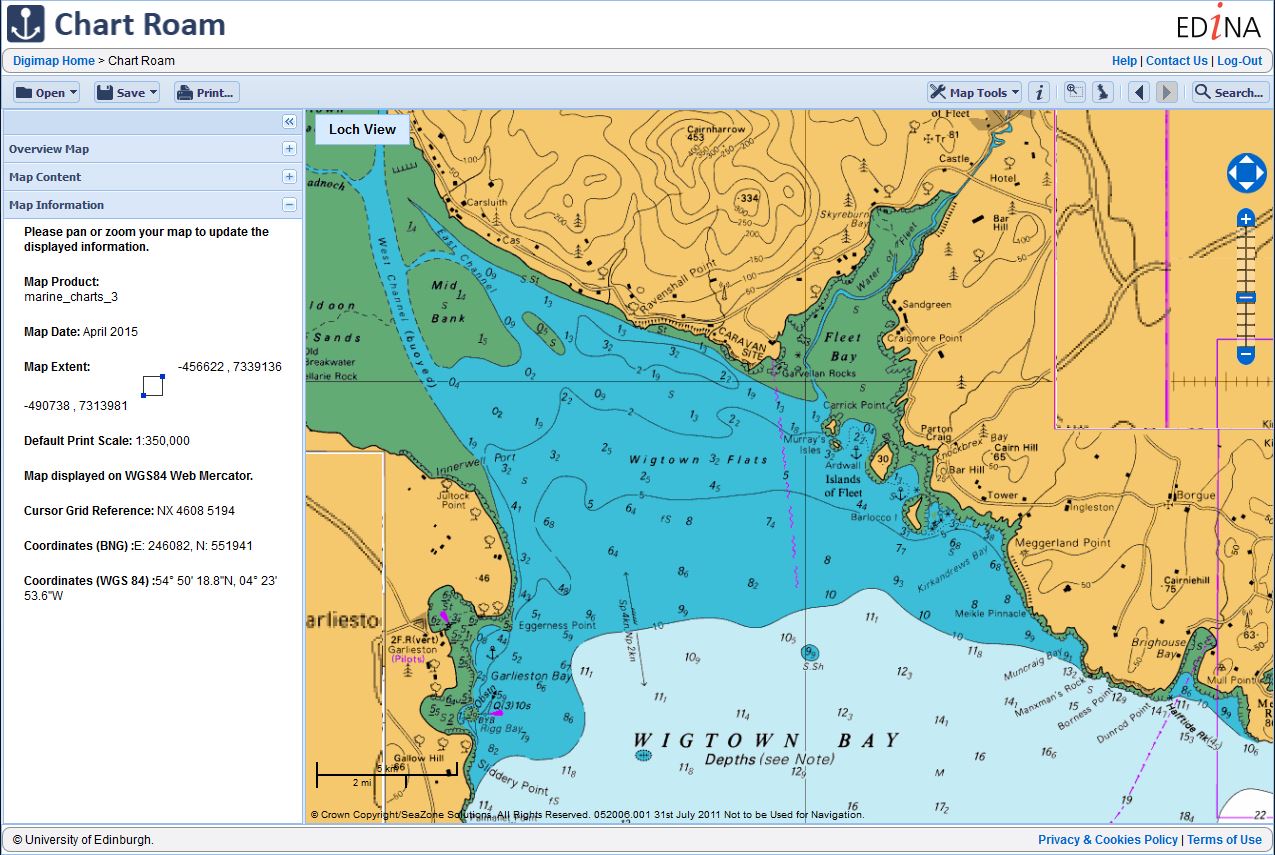
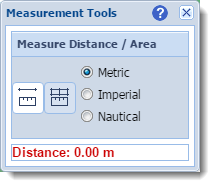 Chart Roam displays marine Hydrographic Charts from SeaZone Solutions using the WGS84 Web Mercator projection. As part of the work done to support the display of map data in different projections we added Nautical Miles to the distance measurement tool in Chart Roam. Users can now measure distances in metric (metres and kilometres), imperial (yards and miles) and nautical units; areas measurements can only be made in metric units at present.
Annotations [all Roam clients]
We have made significant improvements behind the scenes to the way annotations are handled in all Roam applications. This work was done to ensure that users uploading annotations with a large number features can style, save and print the data once loaded in to one of the Roam applications. Other notable improvements are detailed below:
- We have added the ability to load multiple Shapefiles as annotations from a single Zip archive. Previously it was only possible to import a single Shapefile from a Zip archive, and all other Shapefiles were ignored by the import process. Now all Shapefiles in your Zip archive will be added to the map, and they can be of different geometry types e.g. points, lines and polygons.
- We have improved the printing process so that it is possible to create prints that contain many more annotations.
- Improvements have been made to remove some of the internal file size and feature number limits when loading, saving and exporting larger annotations. Note there is a 10MB file size limit when importing annotations.
- Annotations in CSV (comma separate value) format can now be imported using Latitude and Longitude values; previously it was only possible to import CSV annotations in the British National Grid projection.
Ordnance Survey Roam
A number of changes have been made to the Ordnance Survey Roam application, predominantly to rationalise the data available at the different zoom levels:
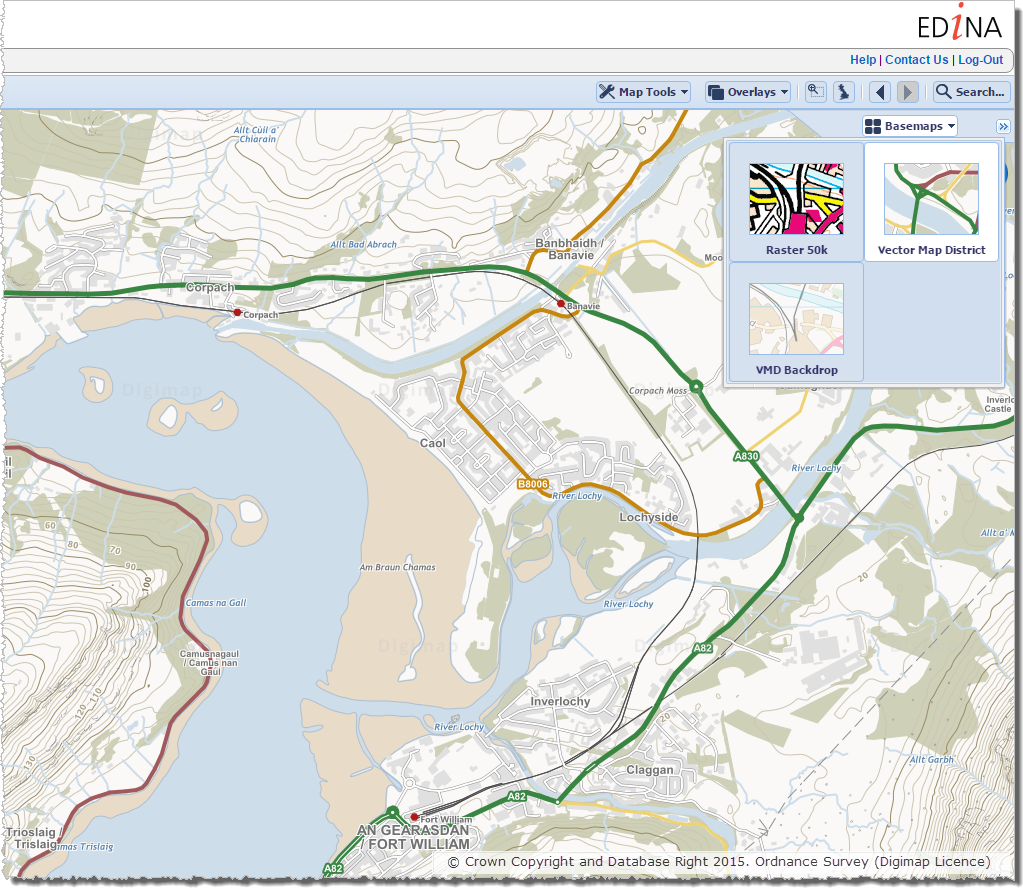
- The vector version of VectorMap District (VMD) has been added to OS Roam and is available at the Local View zoom level (approx. 1:19,000) as an alternative map accessed through the Basemaps option:
- The Local Plus View has been removed and the datasets available in the District and Local Views have been rationalised. Full details of the datasets available in each View can be found on this help page.
Accessing Product Help [all Roam clients]
As well as updating the help pages to cover the changes listed above, we have also changed the Map Information panel in all Roam clients making it easier for users to get help on the particular map product(s) they are currently viewing in the map window.
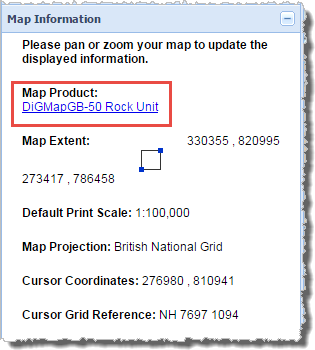
- Hyperlinks to help pages for each product have been added to product names in all Roam clients. The screen grab below was taken from Geology Roam where the hyperlink takes the user through to a help page dedicated to the map product currently displayed in the map window (DiGMapGB-50 Rock Unit):
We hope you enjoy using these new features, and if you have any suggestions for improvements to the service please get in touch:
- Phone: 0131 650 3302
- Email: edina@ed.ac.uk