Case Study Part Two: The Data Complexities

We learned a lot from getting up close with the cultural events data from Data Thistle that we described in the previous blog post. One of the complexities of the data, which has an effect on the results of analyses undertaken with these data, is the difference between categories and tags.
Events are assigned only one category from a static list of 15 categories.
Events can also be assigned multiple tags and these are a crowd-sourced list of descriptors generated by the event creators.
For example, an event categorised as ‘Music’ may also have the tag ‘Folk’ to provide more nuanced information about the genre of music.
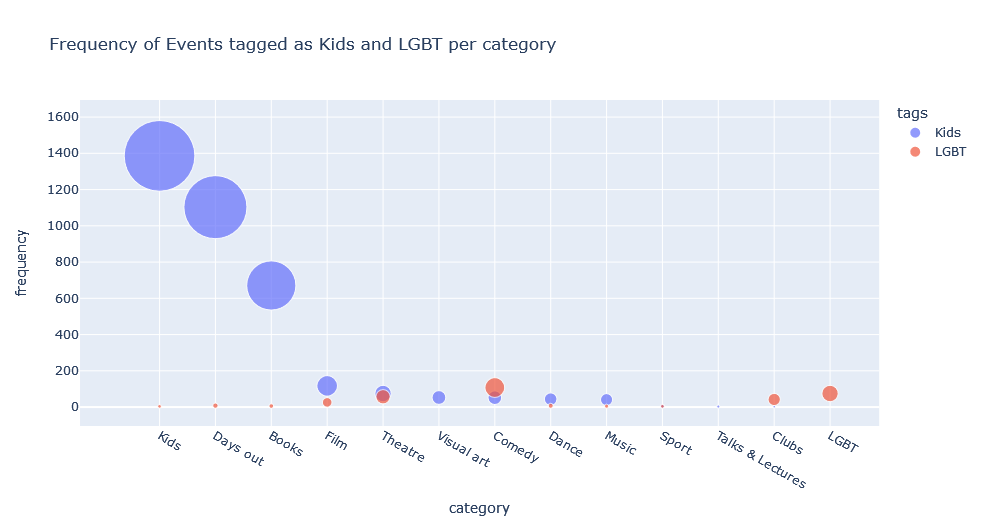
The above graph shows the frequency of events tagged as ‘Kids’ and ‘LGBT’ in each category in our dataset.
In the case of ‘Kids’ events, most events tagged as ‘Kids’ are also categorised as ‘Kids’, however, events tagged as ‘Kids’ also appear in most of the other categories as well. This is the same for events tagged as ‘LGBT’.
As can be seen here, tagging and categorisation are not always in agreement. Understanding the difference between querying the data by category, tag or both will affect the findings that can be gleaned from this data by future users.
(Image courtesy of Rosa Filgueira, ToLCAAH)


